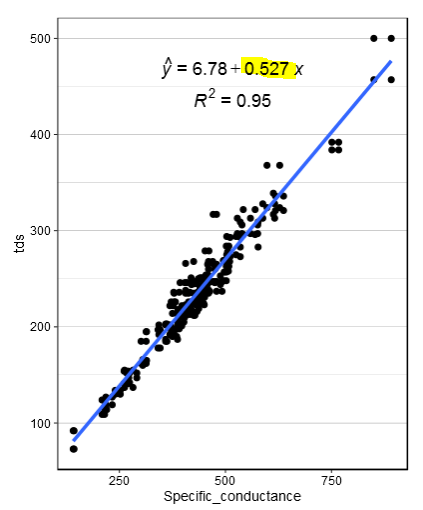
So I'm trying to create a data table that is grouped by a certain column in my data frame, "locid" based on the value that was created by the lm() function in ggplot2. The number highlighted in yellow is what I am looking to get.(Sorry for including image but I don't know the exact technical term for that number)
Is there any way to do this? This is what I have tried so far but it doesn't work
df_cor<-final_new_df%>%
dplyr::group_by(locid)%>%
dplyr::summarise(correl=lm(formula = y~x,Specific_conductance,tds))
Sample Data:
structure(list(stdate = structure(c(16611, 16611, 16615, 16615,
14004, 14004, 16616, 16616, 16616, 17485, 17485, 17483, 17483,
16678, 16678, 14000, 14000, 17211, 17211, 17210), class = "Date"),
sttime = structure(c(37800, 37800, 35100, 35100, 42600, 42600,
38700, 38700, 32400, 35400, 35400, 33000, 33000, 49800, 49800,
34200, 34200, 37800, 37800, 30600), class = c("hms", "difftime"
), units = "secs"), locid = c("USGS-01388500", "USGS-01388500",
"USGS-01464585", "USGS-01464585", "USGS-01464515", "USGS-01464515",
"USGS-01407330", "USGS-01407330", "USGS-01466500", "USGS-01387500",
"USGS-01387500", "USGS-01395000", "USGS-01395000", "USGS-01400860",
"USGS-01400860", "USGS-01377000", "USGS-01377000", "USGS-01367625",
"USGS-01367625", "USGS-01398000"), Specific_conductance = c(525,
525, 184, 184, 226, 226, 203, 203, 41, 674, 674, 466, 466,
312, 312, 540, 540, 844, 844, 683), valunit_sc = c("uS/cm @25C",
"uS/cm @25C", "uS/cm @25C", "uS/cm @25C", "uS/cm @25C", "uS/cm @25C",
"uS/cm @25C", "uS/cm @25C", "uS/cm @25C", "uS/cm @25C", "uS/cm @25C",
"uS/cm @25C", "uS/cm @25C", "uS/cm @25C", "uS/cm @25C", "uS/cm @25C",
"uS/cm @25C", "uS/cm @25C", "uS/cm @25C", "uS/cm @25C"),
HUC14 = c("HUC02030103110020", "HUC02030103110020", "HUC02040201100030",
"HUC02040201100030", "HUC02040201060020", "HUC02040201060020",
"HUC02030104070070", "HUC02030104070070", "HUC02040202030070",
"HUC02030103100030", "HUC02030103100030", "HUC02030104050060",
"HUC02030104050060", "HUC02030105090020", "HUC02030105090020",
"HUC02030103170060", "HUC02030103170060", "HUC02020007010010",
"HUC02020007010010", "HUC02030105030060"), WMA_sc = c(3L,
3L, 20L, 20L, 20L, 20L, 12L, 12L, 19L, 3L, 3L, 7L, 7L, 10L,
10L, 5L, 5L, 2L, 2L, 8L), tds = c(294, 275, 119, 100, 155,
116, 155, 115, 43, 403, 382, 286, 274, 177, 173, 328, 277,
435, 440, 347), valunit_tds = c("mg/l", "mg/l", "mg/l", "mg/l",
"mg/l", "mg/l", "mg/l", "mg/l", "mg/l", "mg/l", "mg/l", "mg/l",
"mg/l", "mg/l", "mg/l", "mg/l", "mg/l", "mg/l", "mg/l", "mg/l"
), WMA_tds = c(3L, 3L, 20L, 20L, 20L, 20L, 12L, 12L, 19L,
3L, 3L, 7L, 7L, 10L, 10L, 5L, 5L, 2L, 2L, 8L), Chloride = c(109,
109, 31.9, 31.9, 33, 33, 36.4, 36.4, 3.38, 153, 153, 72.6,
72.6, 41.5, 41.5, 105, 105, 179, 179, 161), valunit = c("mg/l",
"mg/l", "mg/l", "mg/l", "mg/l", "mg/l", "mg/l", "mg/l", "mg/l",
"mg/l", "mg/l", "mg/l", "mg/l", "mg/l", "mg/l", "mg/l", "mg/l",
"mg/l", "mg/l", "mg/l"), WMA = c(3L, 3L, 20L, 20L, 20L, 20L,
12L, 12L, 19L, 3L, 3L, 7L, 7L, 10L, 10L, 5L, 5L, 2L, 2L,
8L)), .Names = c("stdate", "sttime", "locid", "Specific_conductance",
"valunit_sc", "HUC14", "WMA_sc", "tds", "valunit_tds", "WMA_tds",
"Chloride", "valunit", "WMA"), row.names = c(NA, -20L), class = c("tbl_df",
"tbl", "data.frame"))
I would appreciate any help or guidance or if there is another way to do this. Thanks in advance.