Hi there! I am currently doing Chi Square testing on the categorical variables here which I extracted from my original titanic dataset, containing: Survived, Pclass, Sex, Embarked, FareGroup, AgeGroup, FamilyGroup, Title columns
I have found a method that iteratively tabulates the Chi Square for each pair as shown:
> titanic_chi = subset(titanic, select = c(Survived,Pclass,Sex,Embarked,FareGroup,AgeGroup,FamilyGroup,Title))
> titanic_chi[sapply(titanic_chi,is.character)]<-lapply(titanic_chi[sapply(titanic_chi,is.character)],as.factor)
> eg<-expand.grid(names(titanic_chi),names(titanic_chi))
> eg<-eg[-which(eg$Var1==eg$Var2),]
> for(i in 1:nrow(eg)) {
+     print(rep("#",20))
+     cat(as.character(eg[i,1]),as.character(eg[i,2]),"\n")
+     print(chisq.test(table(df[,eg[i,1]],df[,eg[i,2]])))
+ }
Now the issue is this:
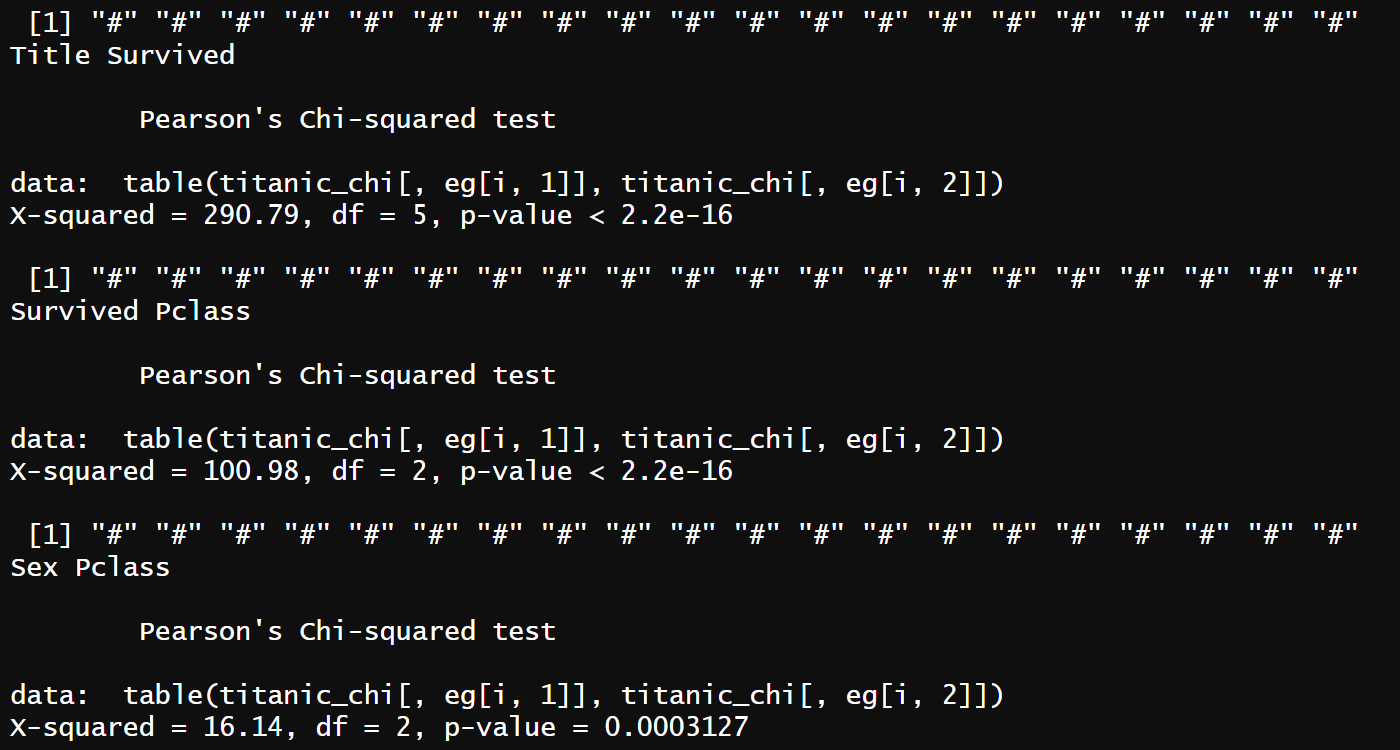
The result is a lot of pairs, and I was thinking if this could be represented in a visualization similar to a correlation coefficient matrix? As it is a little hard to see all the pairs in this way.