Hello! Here is an example code of the current data I am working with and my problem. I am trying to add a break into my x-axis with / /, currently using ggplot but if other packages work then that's great! I tried using plotrix and also using ggbreak and got the closest to my desired output with ggbreak but I would like the clean // break in my graph. This is probably due to my data for the x-axis being dates in POSIXct format as a lot of these packages are for continuous values. Please let me know if you have a solution for me, thank you!
Here is my code (apologies for the long set up for sample data):
# library -----------------------------------------------------------------
library(here)
library(tidyverse)
library(reprex)
library(ggplot2)
library(ggbreak)

# Create continuous data -----------------------------------------------------------------
x1 <- seq(0, 10, length.out = 100)
y1 <- sin(x1)

# Create a gap in the data
x_gap <- seq(10, 50, length.out = 1)
y_gap <- rep(NA, length(x_gap))

# Create more continuous data after the gap
x2 <- seq(50, 60, length.out = 100)
y2 <- cos(x2)

# Combine all parts into a data frame
x <- c(x1, x_gap, x2)
y <- c(y1, y_gap, y2)

# x-values to dates
base_date <- as.Date("2025-03-17")
dates <- base_date + x

# Creating the data frame
df <- data.frame(date = dates, y = y)

# Plot the data  -----------------------------------------------------------------
p1 <- ggplot(df, aes(x = date, y = y)) +
  geom_line(color = "blue") +
  geom_smooth() +
  labs(title = "Plot of Continuous Data with a Gap", x = "X", y = "Y") +
  theme_minimal() +
  theme(panel.grid.major = element_line(color = "gray", size = 0.2), panel.grid.minor = element_blank())

p1 + scale_x_break(c(20, 51))

plot(df$date, df$y, type = "l", col = "blue", main = "Plot with a Gap", xlab = "Time", ylab = "Value")
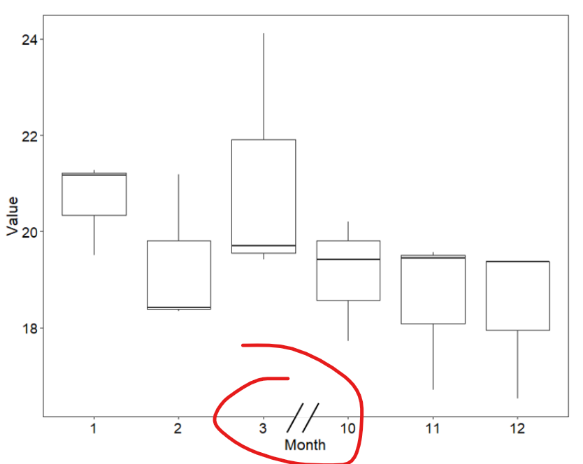
And here is an example of the type of break I am looking for