You can do it using the factor function inside of of a mutate call after your arrange function. Here is an example:
library(dplyr)
#>
#> Attaching package: 'dplyr'
#> The following objects are masked from 'package:stats':
#>
#> filter, lag
#> The following objects are masked from 'package:base':
#>
#> intersect, setdiff, setequal, union
#>
#> Attaching package: 'dplyr'
#> The following objects are masked from 'package:stats':
#>
#> filter, lag
#> The following objects are masked from 'package:base':
#>
#> intersect, setdiff, setequal, union
library(magrittr)
library(ggplot2)
# library(microbenchmark)
n <- 10^5
key <- as.factor(sample(month.abb[1:10], 10))
my_df <- data.frame(month = sample(key, n, replace = TRUE, prob = seq(0.1, 1, 0.1)),
state = sample(c("on", "off"), n, replace = TRUE))
my_df$month[sample(seq_len(n), 100)] <- NA
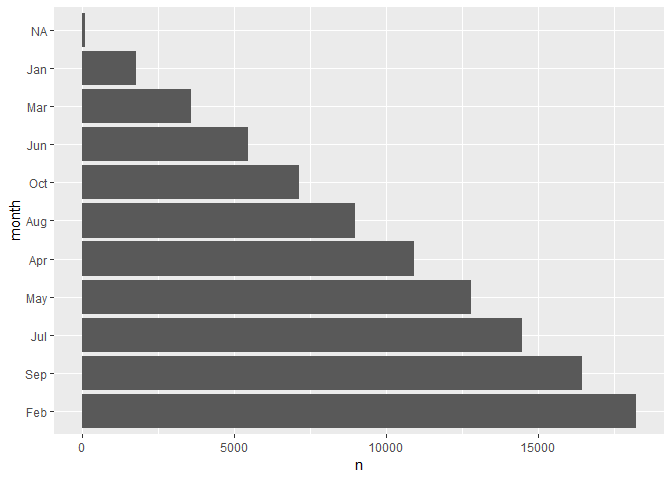
sorted_df_easy <- my_df %>%
count(month) %>%
arrange(-n) %>%
mutate(month = factor(month, levels = unique(month)))
# this doesn't work
ggplot(sorted_df_easy, aes(x = month, y = n)) +
geom_bar(stat="identity") +
coord_flip()
sorted_df_hard <- my_df %>%
  count(state, month) %>%
  arrange(state, -n)  %>%
  mutate(month = factor(month, levels = unique(month)))

# of course, this is even worse
ggplot(sorted_df_hard, aes(x = month, y = n, fill = state)) +
  geom_bar(stat="identity") +
  coord_flip()

Created on 2018-09-04 by the reprex package (v0.2.0).