Hi,
I'm trying to create a barplot with bars ordered from the most frequent category to the less frequent one (btw, this is the right plot to create for factor variables, right? A boxplot would only make sense for categorical x and continuous y). I know of this question which is similar:
But it's not the same: I don't have any facets here. my_df has only two columns, month containing abbreviations of the first 10 months of the year, and state which is either on or off. I want to create a barplot which shows the counts for each month, ideally by status, and ordered by count. I tried to order my dataframe by month count (sorted_df_easy) or by month count and status before plotting it. Both approaches don't work:
library(dplyr)
#>
#> Attaching package: 'dplyr'
#> The following objects are masked from 'package:stats':
#>
#> filter, lag
#> The following objects are masked from 'package:base':
#>
#> intersect, setdiff, setequal, union
library(magrittr)
library(ggplot2)
# library(microbenchmark)
n <- 10^5
key <- as.factor(sample(month.abb[1:10], 10))
my_df <- data.frame(month = sample(key, n, replace = TRUE, prob = seq(0.1, 1, 0.1)),
state = sample(c("on", "off"), n, replace = TRUE))
my_df$month[sample(seq_len(n), 100)] <- NA
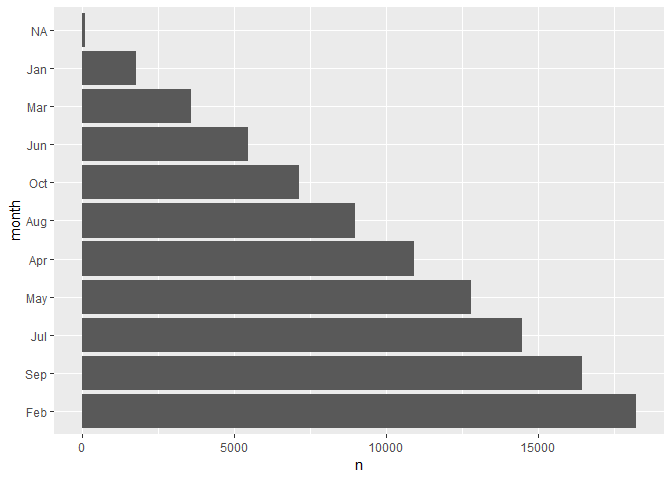
sorted_df_easy <- my_df %>%
count(month) %>%
arrange(-n)
# this doesn't work
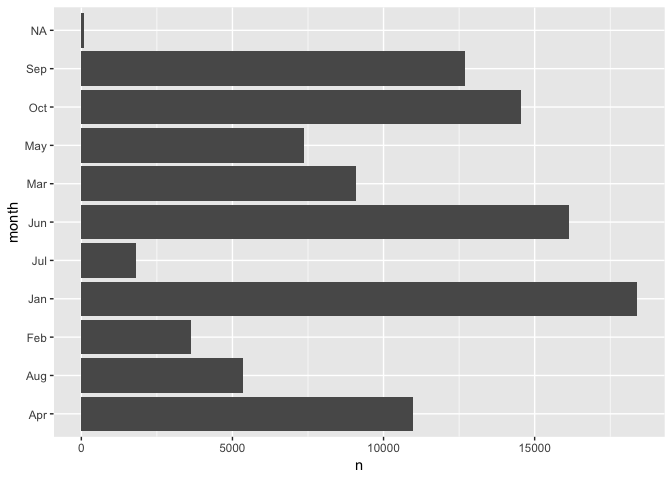
ggplot(sorted_df_easy, aes(x = month, y = n)) +
geom_bar(stat="identity") +
coord_flip()
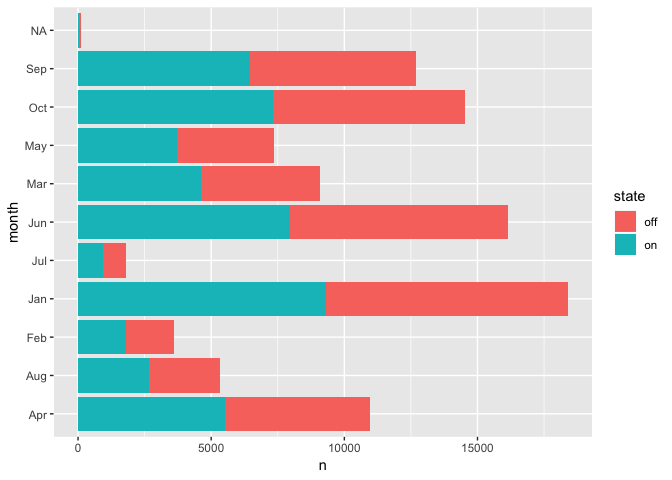
sorted_df_hard <- my_df %>%
  count(state, month) %>%
  arrange(state, -n)

# of course, this is even worse
ggplot(sorted_df_hard, aes(x = month, y = n, fill = state)) +
  geom_bar(stat="identity") +
  coord_flip()
Created on 2018-09-04 by the reprex package (v0.2.0).
Any solutions? Preferably, I'd rather not use forcats - this is for an edge system, and the less stuff I depend on, the better (that's why I don't load tidyverse, btw). Of course, if the forcats is considerably shorter and more readable than the non-forcats solution, I could change my mind.