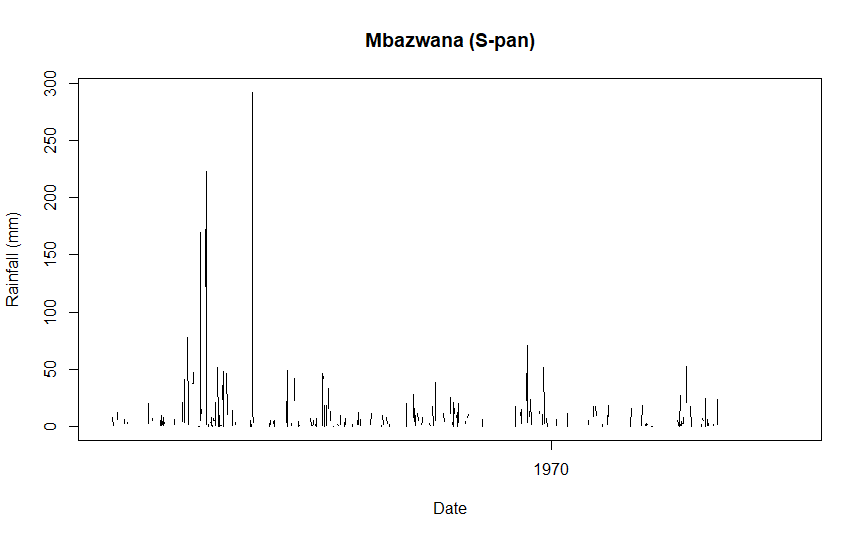
How do I create a 5 year interval scale on my date axis in a plot? I have attached an image of what the date axis currently looks like in my plots.
You could use ggplot2 instead:
Otherwise, provide a reproducible example:
system
Closed
3
This topic was automatically closed 21 days after the last reply. New replies are no longer allowed.
If you have a query related to it or one of the replies, start a new topic and refer back with a link.