I am looking to create a 3D pie chart using ggplot2. The only way I've seen this can be done is using the ggthreed package (ggthreed - 3d pie charts - coolbutuseless).
I've tried running the source code for a faceted 3D plot as follows
Warning: Unknown or uninitialised column: 'subgroup'.
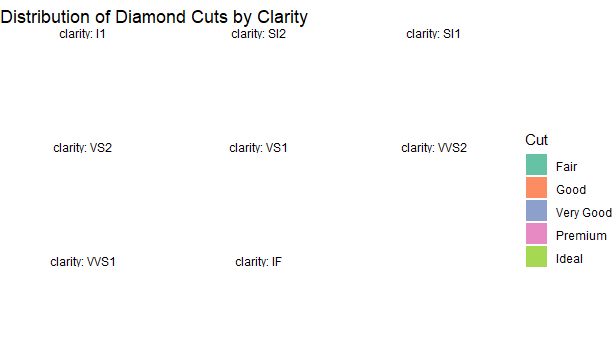
The plots also don't appear in the output (see below). Anyone know how to resolve this issue? (Or to create 3D pie charts in ggplot2 with a package different to ggthreed?
It doesn't work because ggplot detects and suppresses code that commits crimes against visualization.
Okay, just kidding.
The message is a warning, rather than an error (in fact, that same warning occurred in the code posted by the package author on the page you linked to) and probably isn't related to the underlying problem you're experiencing.
I'm not sure why the pie charts aren't appearing. The examples provided by the package author no longer produce pie charts either. The package hasn't been updated in two years (see https://github.com/coolbutuseless/ggthreed) so it might just be that the package has a bug or has not kept up with changes to ggplot2 and/or threed.