create tick labels from a separate data frame

I need to generate tick labels and hopefully titles in ggplots from a separate data frame that is a master list of variables and labels.

# LABELS
master_labels <- data.frame(
  variable   = c(
    "v2_Q", "v3_X","v3_Y","v4_N","v4_O","v1_A","v3_Z","v4_M","v2_R",
    "v1_B","v1_C","v2_S","v1_D","v1_E"  ),
  labels = c(
    "Young Adult Male","Baby Girls","Toddler Girls","Sedan","SUV","Baby Boys",
    "Little Girls","Minivan","Adult Male","Toddler Boys","Little Boys","Big and Tall Male",
    "Big Boys", "Teen Boys"
  ))
master_labels 

# TITLES
titles <- data.frame(
  category = c("v1","v2","v3","v4"),
  title = c("Boy's Department","Men's Department","Girl's Department","Automotive")
)
titles

# Data and Plot
df1 = data.frame(
  variable = c("v2_Q","v3_X","v4_N","v4_O","v1_A","v3_Z","v4_M","v2_R","v3_Y",
                "v1_B","v1_C","v1_D","v1_E","v2_S","v2_T","v3_W"),
  means = c(0.5, 0.35,0.35, 0.35,0.3,0.3,0.3,0.25, 0.25,0.2,0.2, 0.15, 0.15,0.15,
            0.1, 0.1 ))
df1

n=df1$variable
n

#####  Data for Variable 1 Plot 
ni = grepl("v1", n)
df1 = subset(df1, ni)
df1

plot1 = ggplot(data=df1) +
  geom_col(aes(x=variable, y=means,fill=means), position=position_dodge())+
  theme(axis.title.y=element_blank())+
  labs(title = "Means of Variable ???",
       y = "Mean") +
  coord_flip()
plot1

Thanks for the help!
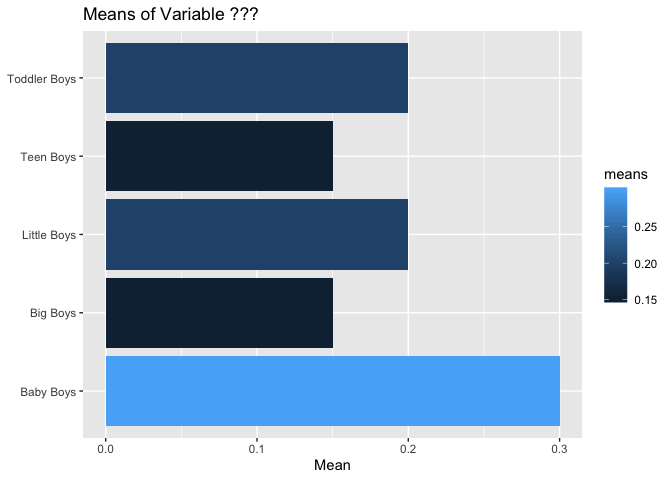
Hi @shp5009: Would it be possible to boil this down to an almost-at-the-end-of-the-process table where the difficulty can be made clear? That would be very helpful, so folks don't have to think through all the code to understand what the issue is.

Ok. I streamlined the code. Thanks.

Thanks, @shp5009 -- very helpful! I'll take a look...

Do you mean something like this? (I changed to using tibbles to avoid the factors created by data.frame().)

library(tidyverse)
# LABELS
master_labels <- tibble(
  variable   = c(
    "v2_Q", "v3_X","v3_Y","v4_N","v4_O","v1_A","v3_Z","v4_M","v2_R",
    "v1_B","v1_C","v2_S","v1_D","v1_E"  ),
  labels = c(
    "Young Adult Male","Baby Girls","Toddler Girls","Sedan","SUV","Baby Boys",
    "Little Girls","Minivan","Adult Male","Toddler Boys","Little Boys","Big and Tall Male",
    "Big Boys", "Teen Boys"
  ))
master_labels 
#> # A tibble: 14 x 2
#>    variable labels           
#>    <chr>    <chr>            
#>  1 v2_Q     Young Adult Male 
#>  2 v3_X     Baby Girls       
#>  3 v3_Y     Toddler Girls    
#>  4 v4_N     Sedan            
#>  5 v4_O     SUV              
#>  6 v1_A     Baby Boys        
#>  7 v3_Z     Little Girls     
#>  8 v4_M     Minivan          
#>  9 v2_R     Adult Male       
#> 10 v1_B     Toddler Boys     
#> 11 v1_C     Little Boys      
#> 12 v2_S     Big and Tall Male
#> 13 v1_D     Big Boys         
#> 14 v1_E     Teen Boys

# TITLES
titles <- tibble(
  category = c("v1","v2","v3","v4"),
  title = c("Boy's Department","Men's Department","Girl's Department","Automotive")
)
titles
#> # A tibble: 4 x 2
#>   category title            
#>   <chr>    <chr>            
#> 1 v1       Boy's Department 
#> 2 v2       Men's Department 
#> 3 v3       Girl's Department
#> 4 v4       Automotive

# Data and Plot
df1 = tibble(
  variable = c("v2_Q","v3_X","v4_N","v4_O","v1_A","v3_Z","v4_M","v2_R","v3_Y",
               "v1_B","v1_C","v1_D","v1_E","v2_S","v2_T","v3_W"),
  means = c(0.5, 0.35,0.35, 0.35,0.3,0.3,0.3,0.25, 0.25,0.2,0.2, 0.15, 0.15,0.15,
            0.1, 0.1 ))
df1
#> # A tibble: 16 x 2
#>    variable means
#>    <chr>    <dbl>
#>  1 v2_Q      0.5 
#>  2 v3_X      0.35
#>  3 v4_N      0.35
#>  4 v4_O      0.35
#>  5 v1_A      0.3 
#>  6 v3_Z      0.3 
#>  7 v4_M      0.3 
#>  8 v2_R      0.25
#>  9 v3_Y      0.25
#> 10 v1_B      0.2 
#> 11 v1_C      0.2 
#> 12 v1_D      0.15
#> 13 v1_E      0.15
#> 14 v2_S      0.15
#> 15 v2_T      0.1 
#> 16 v3_W      0.1

# plot only means for 'v1' labels

master_labels %>% 
  inner_join(df1) %>% 
  filter(str_detect(variable, 'v1')) %>% 
  ggplot() +
  geom_col(aes(x= labels, y=means,fill=means), position=position_dodge())+
  theme(axis.title.y=element_blank())+
  labs(title = "Means of Variable ???",
       y = "Mean") +
  coord_flip()
#> Joining, by = "variable"

Created on 2020-03-06 by the reprex package (v0.3.0)

Yes. I haven't seen tibbles() yet, but just read about it. I'm just starting to learn about piping and tidyverse.

I'm trying to get it to work with my real data and my more complicated code. I get this error:
Error in UseMethod("tbl_vars") :
no applicable method for 'tbl_vars' applied to an object of class "character"

I think the problem is that my data 'df1' is really output from an apply function so the column "variable" is actually the row names from an apply function and not a data frame or tibble. I've been trying to get it converted to a data frame with 2 columns but doesn't seem to work . data.frame() keeps "variable" as the row name and one column is the means. tibble() gets rid of it completely and there is just the column with the means. Any suggestions on how to get this output into a dataframe with the row names as variable column? Or maybe I'm looking at it wrong.

Thank you for the help! I appreciate it.

Could you apply dput() to the objects you're working with, and then post the output here? That might help folks help you. How big are the data objects you're working with?

I have the same errors with the code I tried first. Would that be helpful?
Is it helpful to have it in R markdown so all the output shows?

Now that the context is clearer, that might well help, and the best way to capture what happens on your machine is to 1) apply the dput() function to your data objects, 2) copy the dput() output to a new R file, 3) add library() commands for any packages your code depends on, and then 4) add your code.

A simple next step would be to copy and paste the contents of the new file here the way you did above, but the best thing to do would be to install and load the reprex package, then 1) copy, but don't yet paste, the contents of the new file, 2) run the command reprex() in the console (with no arguments), and finally, 3) paste here directly, without executing another copy command. (Once you copy, reprex() transforms the clipboard, so that what you paste is not what you copied -- this transformed text is what will be pasted here.)

This topic was automatically closed 21 days after the last reply. New replies are no longer allowed.