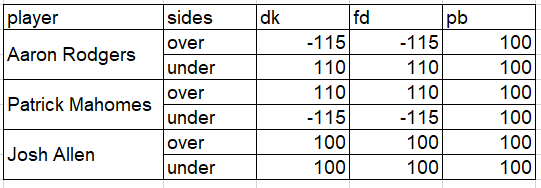
I have a Shiny app in which I'm trying to group rows with the same label in the "player" column of a data frame so that the first cell is essentially merged into one with the rest to follow. Below is how I'm hoping it will look (using Excel to demonstrate):

Is that possible to do in Shiny either with reactable (what I'm currently using) or just a regular shiny datatable? Below is the code I've already set up for the app as a minimal reprex:
players <- c('Aaron Rodgers', 'Aaron Rodgers', 'Patrick Mahomes', 'Patrick Mahomes', 'Josh Allen', 'Josh Allen')
sides <- c('over', 'under', 'over', 'under', 'over', 'under')
dk <- c(-115, 110, 110, -115, 100, 100)
fd <- c(-115, 110, 110, -115, 100, 100)
pb <- c(100, 100, 100, 100, 100, 100)

df <- data.frame(players, sides, dk, fd, pb)

library(shiny)
library(reactable)

ui <- fluidPage(

    titlePanel("Test App"),
    mainPanel(
           reactableOutput("table")
        )
)

server <- function(input, output) {

    output$table <- renderReactable({
        reactable(df)
    })
}

shinyApp(ui = ui, server = server)