I need to create new indicators based on sets of two previously existing indicators. I have a list of the new ones that need to be created, and the indicators that are needed to create them, but I can't figure out how to do it.
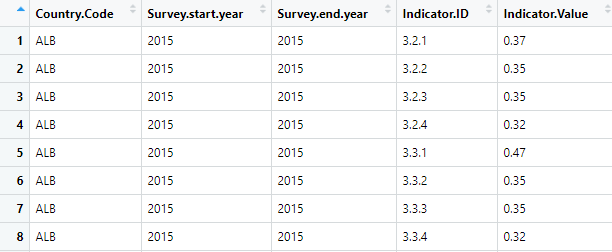
The data is set up like this, and there are around 100 countries and around 50 indicators to be created. So for example, I need to create an indicator with an Indicator.ID of 3.2.1.1 whose Indicator.Value is the Indicator.Value of Indicator.ID 3.2.1 minus the Indicator.Value of Indicator.ID 3.2.2. So these would be new rows in the data (one per new indicator per country), not new columns.
Could you create them in a new data frame then bind them?
It would be easier with a reprex.
A minimal reproducible example consists of the following items:
A minimal dataset, necessary to reproduce the issue
The minimal runnable code necessary to reproduce the issue, which can be run
on the given dataset, and including the necessary information on the used packages.
Let's quickly go over each one of these with examples:
It's a bit ugly maybe, but is this something you are looking for?
JW
require(dplyr)
require(stringr)

df  <- data.frame(Country.Code = rep("ALB",8),
                  Indicator.ID = c("3.2.1", "3.2.2", "3.2.3", "3.2.4",
                                   "3.3.1", "3.3.2", "3.3.3", "3.3.4"),
                  Indicator.Value = c(0.37, 0.35, 0.35, 0.32, 0.47, 0.35, 0.35, 0.32))

df_1  <- df %>% mutate(group_id = str_sub(Indicator.ID, 1, 3)) %>%
        group_by(Country.Code, group_id) %>%
        transmute(Indicator.ID = str_c(Indicator.ID,"1", sep ="."),
              Indicator.Value = Indicator.Value - lead(Indicator.Value,1)) %>%
        ungroup() %>%
        select(-group_id)

bind_rows(df, df_1)
#    Country.Code Indicator.ID Indicator.Value
# 1           ALB        3.2.1            0.37
# 2           ALB        3.2.2            0.35
# 3           ALB        3.2.3            0.35
# 4           ALB        3.2.4            0.32
# 5           ALB        3.3.1            0.47
# 6           ALB        3.3.2            0.35
# 7           ALB        3.3.3            0.35
# 8           ALB        3.3.4            0.32
# 9           ALB      3.2.1.1            0.02
# 10          ALB      3.2.2.1            0.00
# 11          ALB      3.2.3.1            0.03
# 12          ALB      3.2.4.1              NA
# 13          ALB      3.3.1.1            0.12
# 14          ALB      3.3.2.1            0.00
# 15          ALB      3.3.3.1            0.03
# 16          ALB      3.3.4.1              NA
If I understand correctly, another way to do it would be like so:
library(tidyverse)

df  <- data.frame(Country.Code = rep("ALB",8),
                  Indicator.ID = c("3.2.1", "3.2.2", "3.2.3", "3.2.4",
                                   "3.3.1", "3.3.2", "3.3.3", "3.3.4"),
                  Indicator.Value = c(0.37, 0.35, 0.35, 0.32, 0.47, 0.35, 0.35, 0.32))

df %>%
  # This step creates a separate column for each indicator ID
  pivot_wider(names_from = Indicator.ID, values_from = Indicator.Value) %>%
  # This step does whatever math needs to be done between indicators
  mutate(`3.2.1.1` = `3.2.1` - `3.2.2`) %>%
  # This step returns the data to its original "long" format
  pivot_longer(names_to = "Indicator.ID", values_to = "Indicator.Value", cols = -c(Country.Code))
#> # A tibble: 9 x 3
#>   Country.Code Indicator.ID Indicator.Value
#>   <chr>        <chr>                  <dbl>
#> 1 ALB          3.2.1                   0.37
#> 2 ALB          3.2.2                   0.35
#> 3 ALB          3.2.3                   0.35
#> 4 ALB          3.2.4                   0.32
#> 5 ALB          3.3.1                   0.47
#> 6 ALB          3.3.2                   0.35
#> 7 ALB          3.3.3                   0.35
#> 8 ALB          3.3.4                   0.32
#> 9 ALB          3.2.1.1                 0.02
Created on 2021-03-22 by the reprex package (v1.0.0)
system
April 12, 2021, 11:55pm
5
This topic was automatically closed 21 days after the last reply. New replies are no longer allowed.