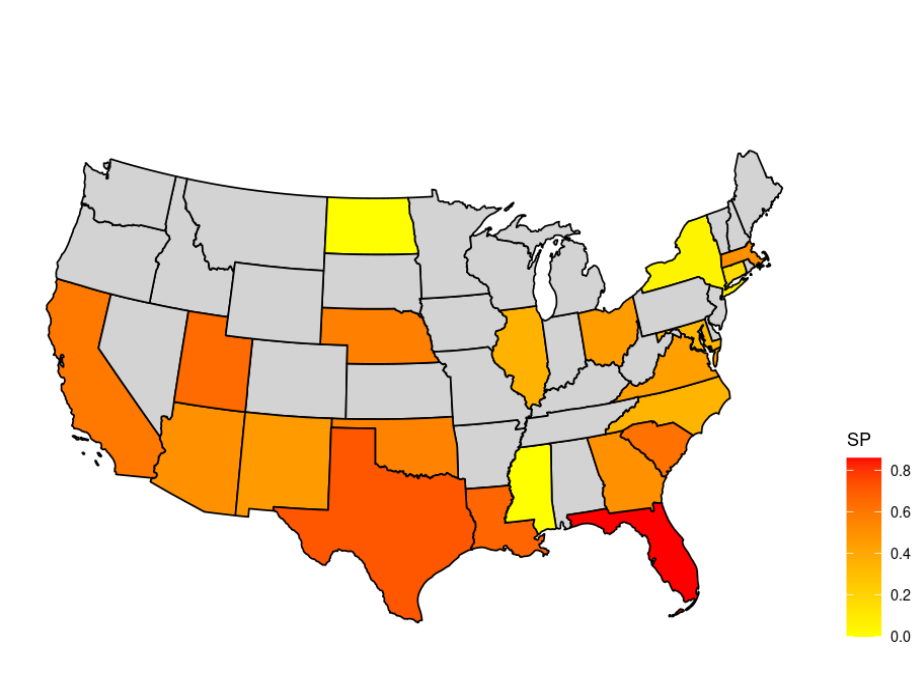
Hi, I am trying to make a us map with some labels per state.
The code I have is this:
Sero <- read_excel("Sero.xlsx")
And I get a really nice map, however I would like the value under the column "Positive" to display in each state, any thoughts?
Thank you!!
Hi, first of all you should provide a reproducible example as we don't have your data. Also you should note what packages you are using in the example.
A minimal reproducible example consists of the following items:
A minimal dataset, necessary to reproduce the issue
The minimal runnable code necessary to reproduce the issue, which can be run
on the given dataset, and including the necessary information on the used packages.
Let's quickly go over each one of these with examples:
Anyway, some options:
This set of geom, stat, and coord are used to visualise simple feature (sf)
objects. For simple plots, you will only need geom_sf() as it
uses stat_sf() and adds coord_sf() for you. geom_sf() is
an unusual geom because it will draw different...
system
April 15, 2022, 9:09pm
3
This topic was automatically closed 21 days after the last reply. New replies are no longer allowed.