Hello,
I have been trying to create an incidence plot using the attached data. I tried using these commands:
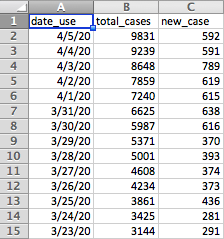
outbreak <- read.csv("[location of attached file]")
outbreak <- outbreak[order(as.Date(outbreak$date_use, format = "%m/%d/%Y")),]
outbreak$date_use <- format(as.Date(outbreak$date_use, format = "%m/%d/%Y"), "%Y-%m-%d")
outbreak$date_use <- as.Date(outbreak$date_use)
library(incidence)
i <- incidence(outbreak)
However I continue to get the error: "Error in is.finite(x) : default method not implemented for type 'list' "
How can I create an incidence plot and epicurve using this data type and command?
I am a new R user, so I really appreciate any and all advice! If this is in the wrong place, please let me know.
Thank you.