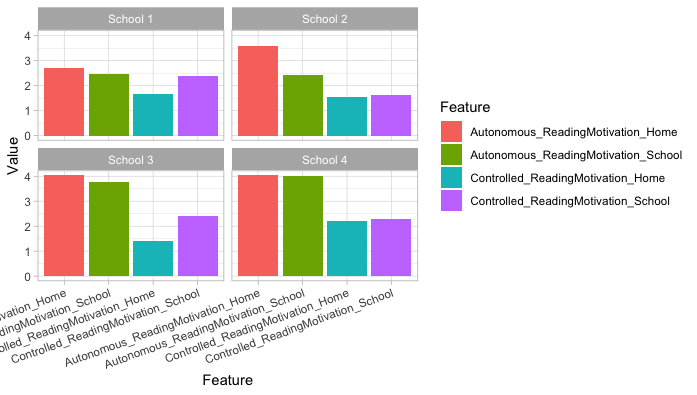
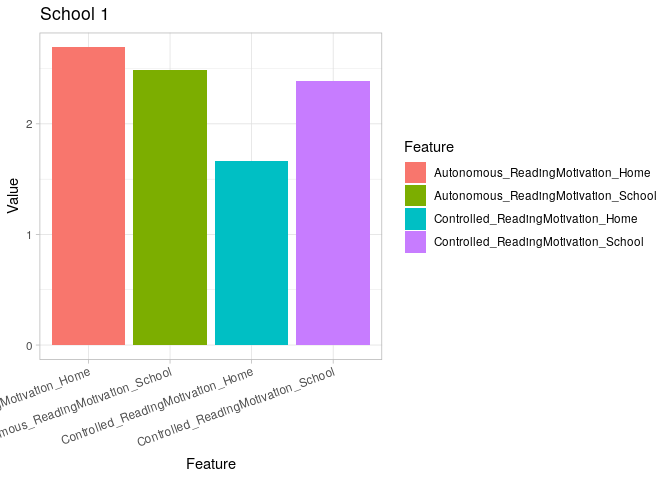
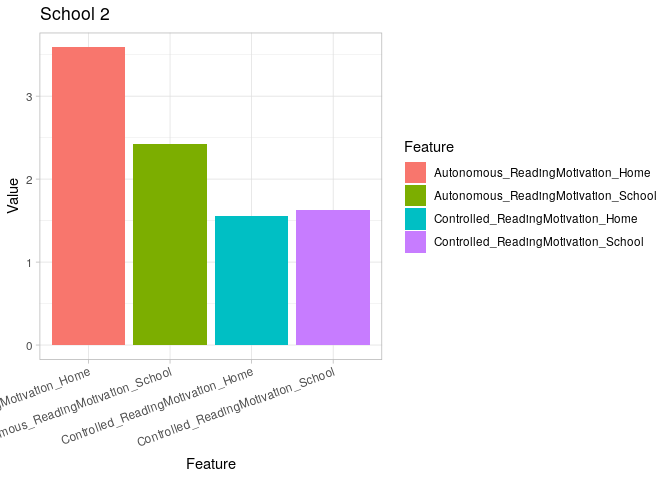
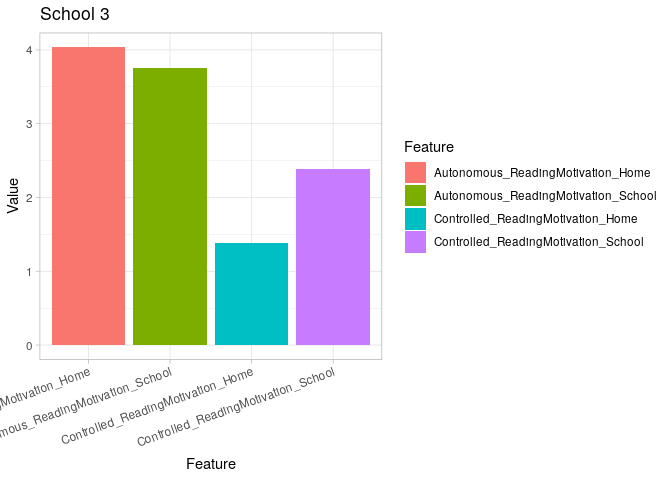
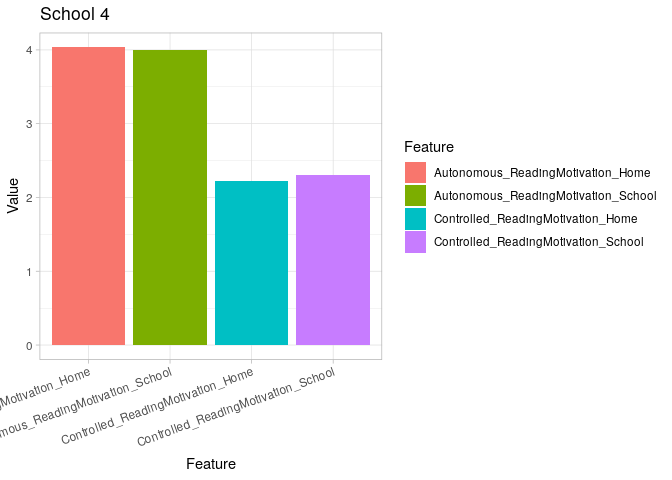
I have one other question. Creating this barplot works very well. However, I was wondering if it is possible to split the barplot, so that I have one barplot for every school (with a legend for every school, a x-as and y-as, ...). I used the function "lapply(split....))", as you can see below, but it doesn't work.
Thank you in advance.
##Used dataset
Example_Data <- tribble(
  ~Student,    ~School, ~AUT_RM_School, ~Contr_RM_School, ~Aut_RM_Home, ~Contr_RM_Home,
  "Studen 1", "School 1",            2.34,              2.89,          1.63,            2.22,
  "Studen 2", "School 1",            2.63,              1.89,          3.75,            1.11,
  "Studen 3", "School 2",            2.63,              1.56,          2.50,            1.33,
  "Studen 4", "School 2",            1.38,              1.56,          4.13,            2.00,
  "Studen 5", "School 2",            3.25,              1.78,          4.13,            1.33,
  "Studen 6", "School 3",            4.50,              2.00,          4.00,            1.44,
  "Studen 7", "School 3",            3.63,              2.67,          4.00,            1.44,
  "Studen 8", "School 3",            2.50,              2.22,          4.00,            1.11,
  "Studen 9", "School 3",            4.38,              2.67,          4.13,            1.56,
  "Studen 10", "School 4",            4.00,              2.67,          4.38,            2.11,
  "Studen 11", "School 4",            3.75,              1.89,          4.75,            2.00,
  "Studen 12", "School 4",            4.13,              2.11,          4.75,            1.56,
  "Studen 13", "School 4",            4.13,              2.56,          2.25,            3.22
)
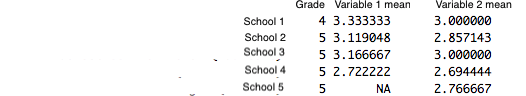
##Calculate mean per school for different variables (AUT_RM_School, Contr_RM_School, Aut_RM_Home, Contr_RM_Home,)
vars_example<- c("AUT_RM_School", "Contr_RM_School", "Aut_RM_Home", "Contr_RM_Home")
summary(Example_Data[vars_example])
aggregate(Example_Data[vars_example], by=list(name1=Example_Data$School), mean, na.rm = TRUE)


Sample_Data <- Example_Data %>%
  group_by(School) %>%
  summarise(Autonomous_ReadingMotivation_School = mean(AUT_RM_School, na.rm = TRUE),
            Controlled_ReadingMotivation_School = mean(Contr_RM_School, na.rm = TRUE),
            Autonomous_ReadingMotivation_Home = mean(Aut_RM_Home, na.rm = TRUE),
            Controlled_ReadingMotivation_Home = mean(Contr_RM_Home, na.rm = TRUE))

# Generating the column plots and split bar plots
lapply(split(DatasetLLN_Rstudio, DatasetLLN_Rstudio$School), function(x){
Sample_Data %>%
  gather(Feature, Value, -School) %>%
  ggplot(aes(x = Feature, y = Value, , fill = Feature)) +
  geom_col(show.legend = TRUE) +
  facet_wrap("School") +
  theme_light() +
  theme(axis.text.x = element_text(angle=20, hjust=1, vjust=1))
}

##Error: unexpected symbol in:
"}
lapply"