Create a plot based purely on user input

Hello,

I am creating a very simple app to show census questions to test my understanding of shiny.
I can create an app using a datatable but I want to learn to create an app where plots of graphs are created based on purely user inputs. In the following app, the only problem is creating a bar plot that shows the number of children put in by the responder. That is, if the responder has 5 children, I expect the bar plot to be taller than if lets say, he selected he had 3 children.

First trial was as follows:

library(shiny)
library(ggplot2)
library(dplyr)
library(plotly)

#define ui ----------------------------
ui <- fluidPage(
  textInput(
    inputId = "first_name", 
    label = "What is your first name? "),
  
  textOutput(
    outputId = "name"),
  selectInput(
    inputId = "university", 
    label = "Have you gone to university? (answer Yes/No): ", 
              choices = c("Yes", "No"), width = "100%"),
  
  numericInput(
    inputId = "children", 
    label = "How many children do you have? ", 
    value =  0, 
    min = 0, 
    max = NA),
  
  radioButtons(
    inputId = "wall_type", 
    label = "What is the wall material of your shelter? ", 
               choices =c("Timber", 
                          "Bricks", 
                          "Iron sheets", 
                          "Stone")),
  textAreaInput(
    inputId = "Livelihood", 
    label = "What has been your major source of livelihood in the past two weeks? ", 
                rows = 5),
  
  textOutput(
    outputId = "livelihood"),
  
  column(
    6, 
    plotOutput(
      outputId = "dependants", 
      width =  "100%"))
)

#define server ----------------------
server <- function(input, output, session){
  dep_plot <- reactive({input$children})
  
  output$name <- renderText(paste0(expr = "Hello ", input$first_name, " today!"))
  output$livelihood <- renderText(paste0(expr = "Looks like your major work is ", input$Livelihood))
  
  output$dependants <- renderPlot({
    input$children
  })
}

#create shiny app ------------------------
shinyApp(ui, server)

This stack overflow - output different plots based on user input in shiny question is closest to my objective. So I followed the methods.

Second trial

library(shiny)
library(ggplot2)
library(dplyr)
library(plotly)
library(DT)

#define ui ----------------------------
ui <- fluidPage(
  textInput(
    inputId = "first_name", 
    label = "What is your first name? "),
  
  textOutput(
    outputId = "name"),
  selectInput(
    inputId = "university", 
    label = "Have you gone to university? (answer Yes/No): ", 
    choices = c("Yes", "No"), width = "100%"),
  
  numericInput(
    inputId = "children", 
    label = "How many children do you have? ", 
    value =  0, 
    min = 0, 
    max = NA),
  
  radioButtons(
    inputId = "wall_type", 
    label = "What is the wall material of your shelter? ", 
    choices =c("Timber", 
               "Bricks", 
               "Iron sheets", 
               "Stone")),
  textAreaInput(
    inputId = "Livelihood", 
    label = "What has been your major source of livelihood in the past two weeks? ", 
    rows = 5),
  
  textOutput(
    outputId = "livelihood"),
  
  column(
    6, 
    plotlyOutput(
      outputId = "dependants", 
      width =  "100%"))
)

#define server ----------------------
server <- function(input, output, session){
  #make response to no. of children reactive
  
  dep_plot <- reactive({input$children})
  
  output$name <- renderText(paste0(expr = "Hello ", input$first_name, " today!"))
  output$livelihood <- renderText(paste0(expr = "Looks like your major work is ", input$Livelihood))
  
  output$dependants <- renderPlotly({
    data = dep_plot()
    print(dep_plot())
  })
  }


#create shiny app ------------------------
shinyApp(ui, server)

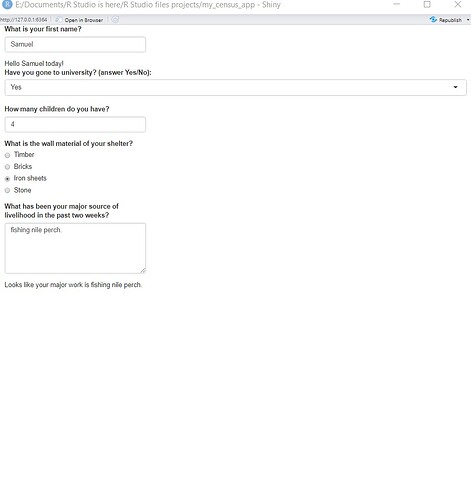
But there is no bargraph that is created based on how many children the user inputs. Could one show me how to go about it?
I'm thinking that your best approach to making further progress in your learning goals would be to step back from shiny per say, and study for a while how plots are made in general (in plain R scripts), once you are familiar and comfortable with that, its a minor step to integrate them into a shiny framework.

In R you can do base plotting:

#a scatter plot
plot(rnorm(n=100))
# a histogram
hist(rnorm(n=100))

You can do ggplot2/tidyverse

library(ggplot2)
 
# The iris dataset is provided natively by R
#head(iris)
# basic scatterplot
ggplot(iris, aes(x=Sepal.Length, y=Sepal.Width)) + 
    geom_point()

data <- data.frame(
  name=c("A","B","C","D","E") ,  
  value=c(3,12,5,18,45)
  )

# Barplot
ggplot(data, aes(x=name, y=value)) + 
  geom_bar(stat = "identity")

for guidance on ggplot approach you can't do better than here

Particularly chapter 3

also

which has examples of both base and ggplot2 charts

Hello @nirgrahamuk,

I am well experienced with ggplot, but the issue is that shiny is a bit more advanced but I know I am hacking it. I just wanted to understand the concept of, how to make the bars appear when a user inputs into the app say, the no. of children in this case. This is just to get a feel how such an app would work if it were deployed en masse, ie. the length of barplots representing the no. of children per family would depend on how many children most families in that population have (ie. the bar of 3 children would be very high as a guess comparted to that of 5, 4, 6 since most families have 3 children etc). I hope you get the point. Plus, I am learning r shiny from shinyapp.io. after Mastering Shiny book became too complex past chapter 1.

its essentially exactly the same as doing it in a non-shiny script. although instead of a conventional variable that you might set by hardcoding in a script

num_of_something <- 5

you have

input$num_of_something

which the user can set to 5 by manipulating the num_of_something named numericInput (or slider or whatever).

Neither of your shiny scripts featured any plotting code, so plotting was never going to happen, and was why I emphasised you come up with some conventional, non shiny plotting code first, if you want the plot to depend on some number, then write a conventional plotting script that is driven by the choice of a number, then simply put it in a shiny context.

Okay, this is an enigma of some sorts,

I managed to sort the app out with the following code: I put in choices = list(counties$name) in the selectInput argument.

Here is the full code:

#load the requisite packages
library(shiny)
library(ggplot2)
library(dplyr)
library(DT)

#load the census data

load('counties.RData')
attach(counties)

#define UI ---------------------------
ui <- fluidPage(
  sidebarLayout(
    sidebarPanel(
      selectInput(
        inputId = "x",
        label = "X-axis:",
        choices = 'name'
      ),
      
      selectInput(
        inputId = "y",
        label = "Y-axis",
        choices = c('Male', 'Female', 'Intersex', 'Total')
      ),
      
      selectInput(
        inputId = "z",
        label = "Color by:",
        choices = c('County' = 'name', 'Male', 'Female', 'Intersex', 'Total')
      ),
      
      selectInput(
        inputId = "q",
        label = "Select-axis:",
        choices = list(counties$name),
        selected = "Mombasa",
        multiple = T
      ),
      
      downloadButton(
        outputId = "stat_download", label = "Download census statistics"
      )
    ),
    
    mainPanel(plotOutput(outputId = "census_statistics"),
              dataTableOutput(outputId = "census_table"))
  )
)

#define the server --------------------------------
server <- function(input, output, session){


  selected <- reactive({
    req(input$q)
    counties %>%
      filter(name %in% input$q)
  })
  
  output$census_statistics <- renderPlot({
    ggplot(selected(), aes_string(x=input$x, y=input$y, color = input$z)) + 
      geom_point(size = 2) + theme(axis.text.x = element_text(size = 11, angle = 45, hjust = 1, vjust = 1))
  })
  
  output$census_table <- renderDT(
    
    selected(), options = list(pageLength = 5), rownames = F
  )
  
  output$stat_download <- downloadHandler(
    filename = function(){
      paste("data-", ".csv", sep = "")
    },
    content = function(file){
      write.csv(selected(), file)
    }
  )
}

#create the shiny app
shinyApp(ui, server)

Doing the same procedure with a different dataframe but its not working on that particular dataframe! Thanks anyway, the concept has been known. I will try to learn my way from here

This topic was automatically closed 54 days after the last reply. New replies are no longer allowed.

If you have a query related to it or one of the replies, start a new topic and refer back with a link.