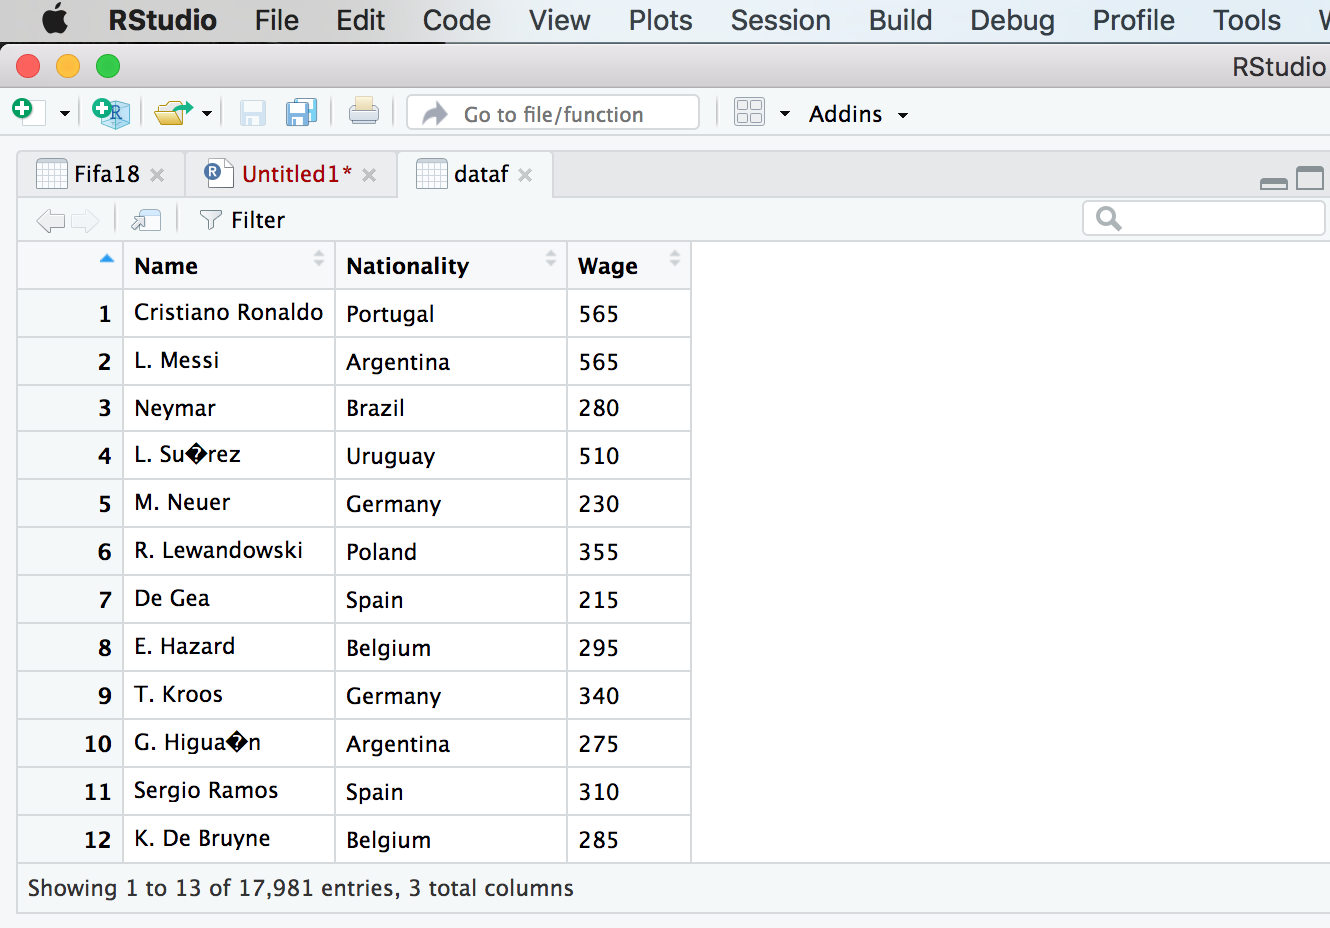
I'm working with a table of data's about fifa with the variables "Name" "Wage" "Nationality" . I'd like to create a new table with the variable "Wage >= 12" and an other one with Wage=<12. (12 is the average wage) . How can I generate those new table without changing my excel , so thanks to R studio ?
Thank you very much for your help.
Using dplyr is should be straightforward to filter your table. I would advice to read this book. You'll find answer on how to do such task https://r4ds.had.co.nz/
Thank you very much for your answer. Firstly, I have tried to generate a new variable with wage>=12 and then put this variable in a new table but it didn't work. I will read your documentation, thanks for this !
If your question's been answered (even by you!), would you mind choosing a solution? It helps other people see which questions still need help, or find solutions if they have similar problems. Here’s how to do it:
 . I'd like to create a new table with the variable "Wage >= 12" and an other one with Wage=<12. (12 is the average wage) . How can I generate those new table without changing my excel , so thanks to R studio ?