Hi,
I don't know if my idea is the best option, but I found a way to create a nice looking grid and have it be responsive to the size of your window. I based it on this W3Schools article. All I did was adapt the code so it'd have captions and the images are clickable (link to whatever specified) also based on another article on that site.
This is my final code:
library(shiny)

ui <- fluidPage(

  #It's better to have the CSS in a separate file is it's long
  tags$head(
    tags$style(HTML("
            * {
        box-sizing: border-box;
      }

      body {
        margin: 0;
        font-family: Arial;
      }

      .header {
        text-align: center;
        padding: 32px;
      }

      .row {
        display: -ms-flexbox; /* IE10 */
        display: flex;
        -ms-flex-wrap: wrap; /* IE10 */
        flex-wrap: wrap;
        padding: 0 4px;
      }

      /* Create four equal columns that sits next to each other */
      .column {
        -ms-flex: 25%; /* IE10 */
        flex: 25%;
        max-width: 25%;
        padding: 0 4px;
      }

      .column img {
        margin-top: 8px;
        vertical-align: middle;
        width: 100%;
      }

      /* Responsive layout - makes a two column-layout instead of four columns */
      @media screen and (max-width: 800px) {
        .column {
          -ms-flex: 50%;
          flex: 50%;
          max-width: 50%;
        }
      }

      /* Responsive layout - makes the two columns stack on top of each other instead of next to each other */
      @media screen and (max-width: 600px) {
        .column {
          -ms-flex: 100%;
          flex: 100%;
          max-width: 100%;
        }
      }

    "))
  ),

  titlePanel("Adaptive image grid with captions and links"),
  uiOutput("myGrid") #this will hold the grid
)

server <- function(input, output, session) {

  #Create a fake dataset (replace with your own)
  imgData = data.frame(path = paste0("https://picsum.photos/id/", sample(1:200, 14), "/200/"),
                       caption = c(paste("This is the caption for image", 1:14)),
                       link = rep("https://forum.posit.co", 14))

  #Calculate the number of images per column (4 in total)
  nImages = nrow(imgData)
  perCol = rep(floor(nImages/4), 4)
  if(nImages %% 4 > 0){
    perCol[1:(nImages %% 4)] = perCol[1:(nImages %% 4)] + 1
  }
  perCol = cumsum(c(1, perCol))

  #Create the HTML for the image grid
  imageGrid = paste(
    "<div class='row'>",
    paste(purrr::map(1:4, function(i){
      paste("<div class='column'>",
            paste0("<a href='", imgData[perCol[i]:(perCol[i+1]-1), "link"], "' target='_blank'><img src='",
                   imgData[perCol[i]:(perCol[i+1]-1), "path"],"' style='width:100%'></a><p>",
                   imgData[perCol[i]:(perCol[i+1]-1), "caption"],"</p>", collapse = ""),
            "</div>", collapse = "")
    }), collapse = ""),
    "</div>")

  #Paste the image grid HTML into Shiny
  output$myGrid = renderUI({
    HTML(imageGrid)
  })
}

shinyApp(ui, server)
Notice there is a lot of CSS to make it adaptive to the window size (that's a cool extra  ) but I'd recommend you put the CSS in a separate file.
The core of the code hovers around this function:
imageGrid = paste(
    "<div class='row'>",
    paste(purrr::map(1:4, function(i){
      paste("<div class='column'>",
            paste0("<a href='", imgData[perCol[i]:(perCol[i+1]-1), "link"], "' target='_blank'><img src='",
                   imgData[perCol[i]:(perCol[i+1]-1), "path"],"' style='width:100%'></a><p>",
                   imgData[perCol[i]:(perCol[i+1]-1), "caption"],"</p>", collapse = ""),
            "</div>", collapse = "")
    }), collapse = ""),
    "</div>")
It seems a bit messy, but it's a series of paste commands to achieve the desired HTML structure. An example is seen here (in reality much longer depending on the number of images):
<div class='row'>
	<div class='column'>
    	<a href='https://forum.posit.co' target='_blank'>
        <img src='https://picsum.photos/id/144/200' style='width:100%'></a>
        <p>This is the caption for image 1</p>

        <a href='https://forum.posit.co' target='_blank'>
        <img src='https://picsum.photos/id/65/200' style='width:100%'></a>
        <p>This is the caption for image 2</p>

    </div>
    <div class='column'>
    	<a href='https://forum.posit.co' target='_blank'>
        <img src='https://picsum.photos/id/63/200' style='width:100%'></a>
        <p>This is the caption for image 3</p>

        <a href='https://forum.posit.co' target='_blank'>
        <img src='https://picsum.photos/id/59/200' style='width:100%'></a>
        <p>This is the caption for image 4</p>
    </div>
</div>
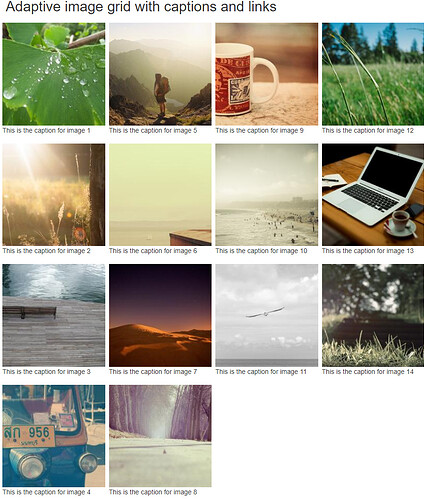
Anyway, the final result looks like this:
There is a lot to customize here since it's all HTML, but I think it's an easier and more flexible way than trying it with a plot.
Maybe someone else has another idea for doing this...
Hope this helps,
PJ
