How do I create a graph and table in R Studio?
Please provide more details. Do you already have the data loaded into R? What do the data look like? If they are already loaded into a data frame named DF, posting the output of
dput(head(DF))
is often helpful. What kind of graph do you want to make? What kind of table do you want to make?
I would like to create simple pie chart or bar graph.
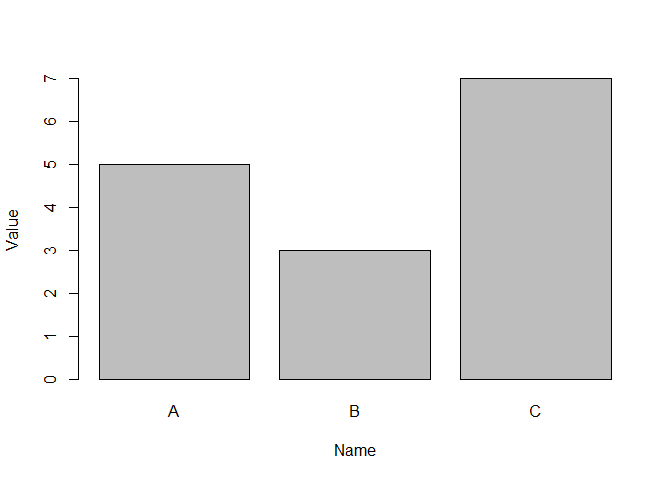
There are many ways to make plots. Here is a simple example. If you provide more details about your data and goals, someone may be able to give more specific guidance.
DF <- data.frame(Name = c("A", "B", "C"), Value = c(5,3,7))
barplot(Value ~ Name, data = DF )
Created on 2020-10-26 by the reprex package (v0.3.0)
This topic was automatically closed 21 days after the last reply. New replies are no longer allowed.
If you have a query related to it or one of the replies, start a new topic and refer back with a link.