See the FAQ: How to do a minimal reproducible example reprex for beginners. Being able to cut-and-paste a data frame is an advantage to attracting answers.
Every R problem can be thought of with advantage as the interaction of three objects— an existing object, x , a desired object,y , and a function, f, that will return a value of y given x as an argument. In other words, school algebra— f(x) = y. Any of the objects can be composites.
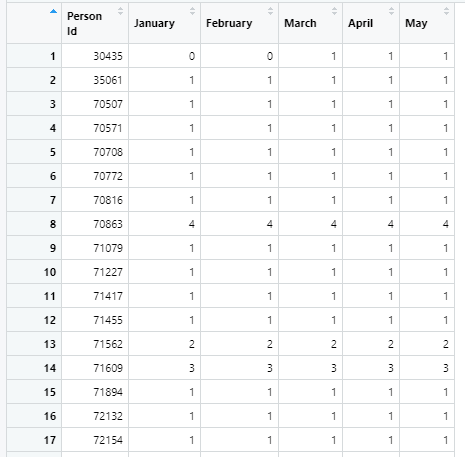
In this case, PersonDedupe2 (which I'll refer to as dat) plays the role of x. It's a matrix-like object (a two-dimensional array of all numeric values) that may be of class matrix, data.frame or tibble.
y is the desired output, which I'll refer to as out, which will also be a matrix-like object consisting of 5 variables—one for PersonID (which I'll refer to as id) and one for each of feb, mar, apr and may.
f is the function to be composed that populates out. Let's start with a single variable in dat, February.
The first row of dat illustrates one outcome—the current and prior months are both zero, which is an unprovided for case in the problem description, a subject with no recorded activity in the past or current month. I'll encode that case as NA.
The second row records a subject with non-zero activity in both the current and prior month, so that can be encoded as existing if the activity is equal each month, otherwise changed.
Not shown for February is the case in which the current month is 1 or more and the prior month is 0, so that can be encoded as new.
With that in mind, the following code tests each pair of column vectors and sets the appropriate encoding (user to verify) in a new data frame. The code is hardwired, which is poor practice when programming for a recurring need—object names, column positions and encoding should all be parameterized.
# for reproducibility
set.seed(137)
# assortment of integers
basket <- c(rep(0,50),rep(1:4,15))
# simulated data
dat <- data.frame(id = sample(30000:40000,25),
                  Jan = sample(basket,25),
                  Feb = sample(basket,25),
                  Mar = sample(basket,25),
                  Apr = sample(basket,25),
                  May = sample(basket,25))

# receiver data frame same id value as dat; otherwise all NA
out <- data.frame(id = dat[,1],
                  dummy = rep(NA,25), # convenience for ease of indexing
                  feb = rep(NA,25),
                  mar = rep(NA,25),
                  apr = rep(NA,25),
                  may = rep(NA,25))

# gets row indices
get_row_indices <- function(x) {
  nas =     which(dat[,x] == 0 & dat[,x-1] == 0)
  news =    which(dat[,x] >  0 & dat[,x-1] == 0)
  ended =   which(dat[,x] == 0 & dat[,x-1] >  0)
  changed = which(dat[,x] >  0 & dat[,x-1] >  0)
  return(list(nas,news,ended,changed))
}

# uses row indices to change the out data frame
populate_out <- function(x) {
  idx = get_row_indices(x)
  out[idx[[1]],x] = NA
  out[idx[[2]],x] = "new"
  out[idx[[3]],x] = "exited"
  out[idx[[4]],x] = "changed"
  return(out)
}

# loops over the month columns after January
for (i in 3:6) out = populate_out(i)

# removes dummy column

out <- out[,-2]

out
#>       id     feb     mar     apr     may
#> 1  39786  exited     new  exited    <NA>
#> 2  30892 changed  exited     new changed
#> 3  37534    <NA>     new  exited    <NA>
#> 4  31446  exited     new changed  exited
#> 5  37802  exited    <NA>     new changed
#> 6  30220     new changed  exited     new
#> 7  33562     new  exited    <NA>    <NA>
#> 8  38098     new changed changed changed
#> 9  32171    <NA>    <NA>     new changed
#> 10 35609  exited    <NA>    <NA>     new
#> 11 30064 changed changed changed  exited
#> 12 37915     new  exited     new changed
#> 13 31437    <NA>     new changed changed
#> 14 31583  exited     new changed changed
#> 15 38205 changed  exited    <NA>     new
#> 16 33307  exited     new  exited    <NA>
#> 17 33459  exited    <NA>     new  exited
#> 18 38069  exited    <NA>    <NA>     new
#> 19 34731  exited    <NA>     new  exited
#> 20 38152    <NA>     new changed  exited
#> 21 30415 changed  exited     new changed
#> 22 35516 changed changed  exited     new
#> 23 39822 changed changed changed  exited
#> 24 31037 changed changed  exited    <NA>
#> 25 33234    <NA>     new  exited     new