Authors: Niels van der Velden - GitHub - Website - Twitter - LinkedIn
View the Table - Repo
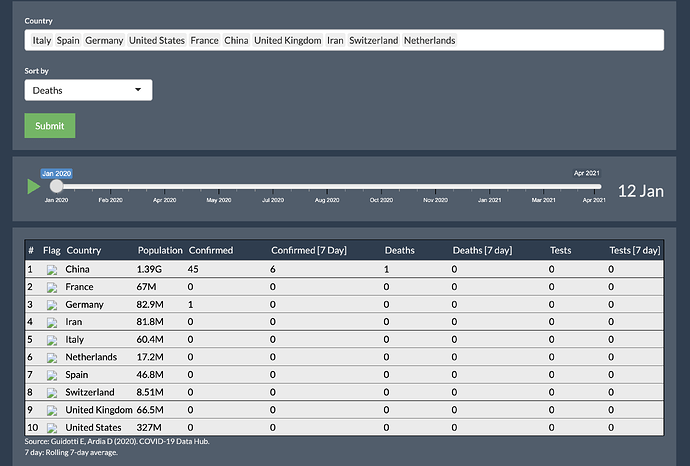
The app was made using the R2D3 package and the D3.js library. Flexbox was used for the design of the table. The data comes from the COVID-19 R package and is continuously updated.
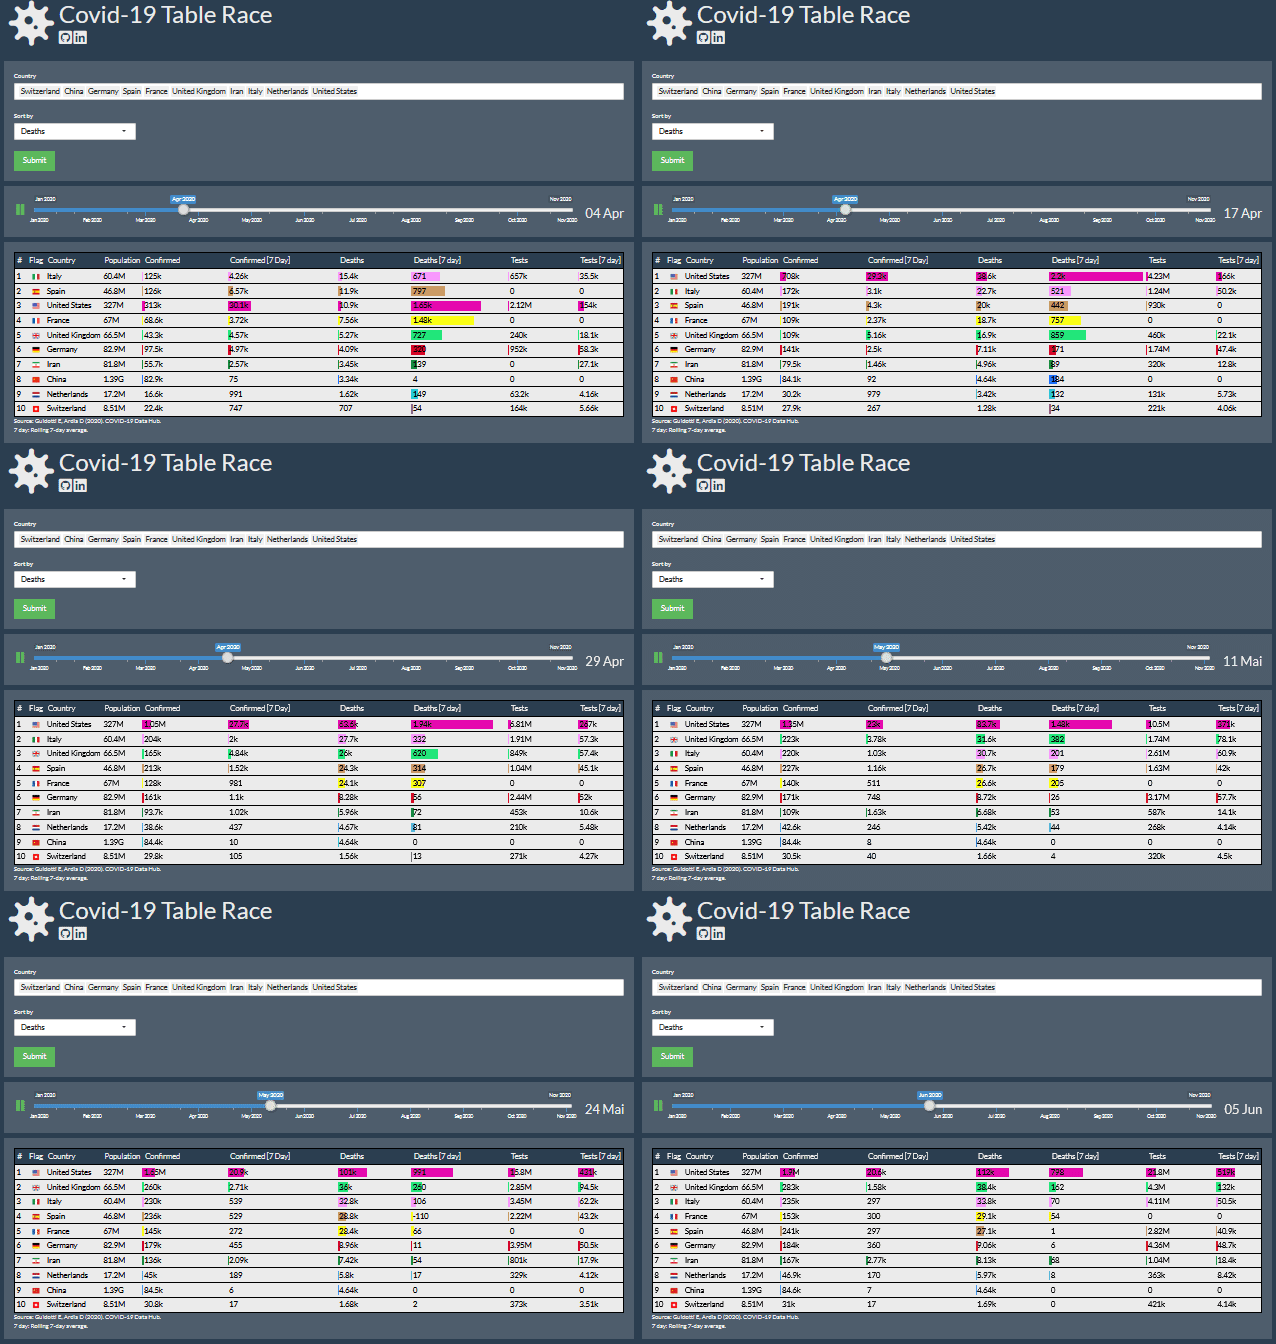
The D3.js library gives extended control over updating, entering and removing data selections. This allows for fast rendering speeds and the option to set transitions between data changes. This makes it possible to animate data over time (as illustrated in the app) or for instance to visualize sensory input data.

Note: The app runs on my own server as the R2D3 CRAN version is not yet compatible with D3.js version 6.
