Authors: Shubhram Pandey
Working with Shiny more than 1 year
Abstract: This platform provides a clear visualization of Covid19 impact all over the world using spread data, forecasted data and sentiment analysis.
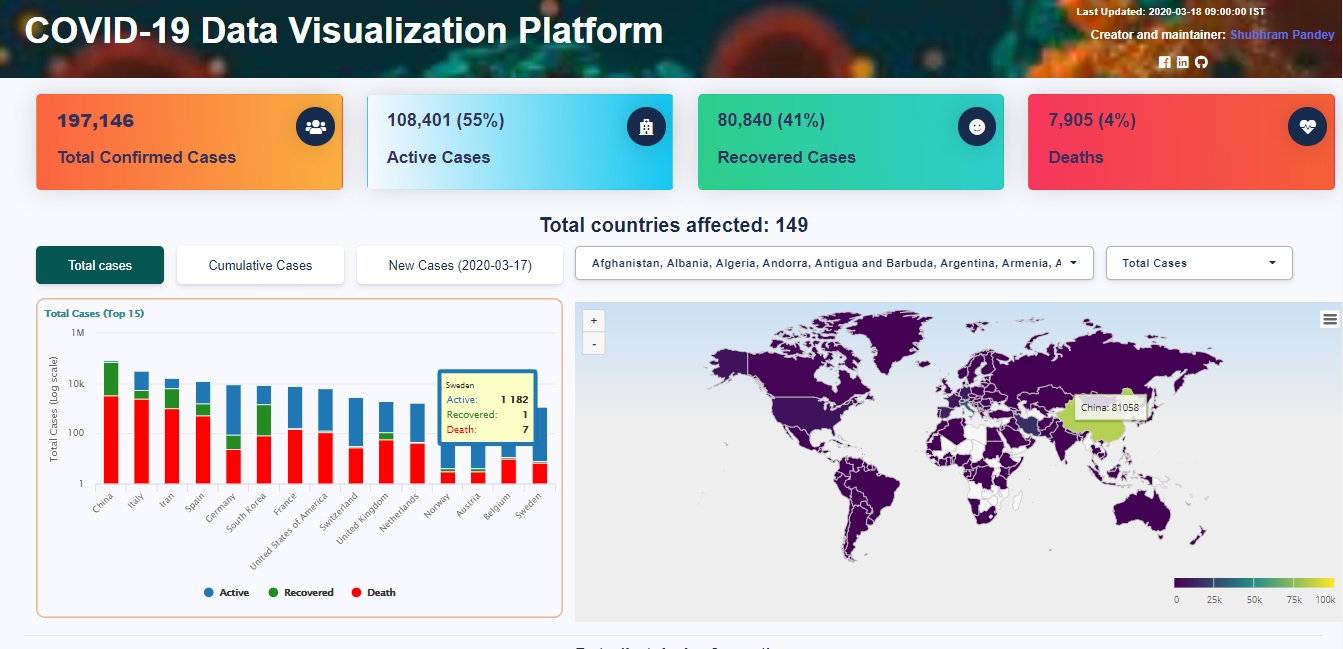
Full Description: COVID-19 Data Visualization Platform provides a clear visualization of coronavirus impact around the world in both graphical and tabular way. This uses data from a github page ulklc.
This platfrom also allows user to compare the spread of covid-19 in more than two countries at one go in both graphical as well as tabular way. It has the capability of running a sentiment analysis using natural language processing (NLP) of the latest 10,000 tweets on twitter having hashtags of coronavirus and covid19. It also uses Infectious disease modelling to forecast the extent of pandemic in any country.
Thanks for this, I really like the visualisation; it's particularly great to have a colour-coded world map with tool tips for the total cases. Do you have date information as well? A date slider (i.e. frame=date) would be great for looking at progression over time.
I think the multi-data log scale is a bit confusing as presented. The china example is demonstrative of this: there are a lot more "recovered" cases than "dead" cases, but the opposite seems to be the case as presented in the graph. I'd recommend putting the bars side-by-side as a log scale. Colouring them based on their linear proportion is another option, but demonstrating how that works on a scale is tricky.
Thank you so much for looking into this and your thoughts on the applications.
I will make the necessary changes and suggested by you. I would like to ask one thing, my app is loading slow, could you please suggest something to make it bit loads faster.
Thank you so much. Looks very good. I'm getting just started w/ R. Do you have a contact information? Would you please suggest how you learned R and what resources did you use ?