I assume your data looks similar to my df below.
Please note that it would be easier to help if you could post some sample data (using dput()), if you provided a reprex, and/or if you provided the desired output. For more info on that, please see the FAQ.
It might help you, that you are dealing with ranked or ranking data. For example, this brings up the following question: How to analyase ranking data in R please?
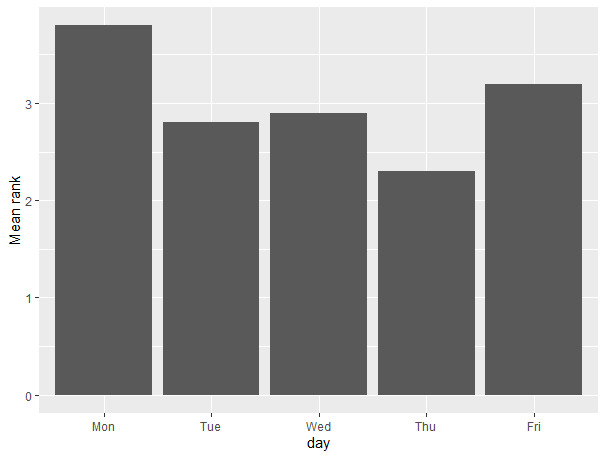
Finally, here is some code do deal with your data. Therein, I computed the average rank for each day and then plotted this average rank. I hope this leads you in the right direction. If not, please provide details about the desired result.
library("tidyverse")

set.seed(1)

days <- c("Mon", "Tue", "Wed", "Thu", "Fri")

# generate example data frame df
df <- data.frame(pers = 1:10,
                 resp = replicate(10, paste(sample(days), collapse = "; ")))

head(df)
#>   pers                    resp
#> 1    1 Mon; Thu; Wed; Fri; Tue
#> 2    2 Fri; Wed; Thu; Tue; Mon
#> 3    3 Wed; Fri; Mon; Thu; Tue
#> 4    4 Tue; Fri; Thu; Wed; Mon
#> 5    5 Mon; Wed; Fri; Thu; Tue
#> 6    6 Mon; Tue; Fri; Wed; Thu

res <- separate(df, col = resp, into = paste0("rank", 1:5)) %>%
    pivot_longer(cols = -pers, values_to = "day") %>%
    mutate(rank = as.numeric(sub("rank", "", name)),
           day = factor(day, levels = days)) %>%
    group_by(day) %>%
    summarize(M = mean(rank))

res
#> # A tibble: 5 x 2
#>   day       M
#>   <fct> <dbl>
#> 1 Mon     2.8
#> 2 Tue     3
#> 3 Wed     3.1
#> 4 Thu     3.2
#> 5 Fri     2.9

ggplot(res, aes(x = day, y = M)) +
    geom_col() +
    labs(y = "Mean rank")
