Counting profit / loss

Hello, So i've managed to get to a point where i found out some conditions that I would like to create an entry order for. But I have no idea how to create the code to track profits

Basically, what i want to do is to look at the last column, if it is +engulf that is a buy order, if it is -engulf that is a sell order.

The buy and sell orders will happen on the N+1 row of the Open. This means the next open candle.

Does anyone know how to do this??? I am really stuck. So far i am trying to write ifelse statements but its not going anywhere fast. I am also trying to include a take profit and a stop loss to track.

The take profit I am looking for now could be simple, either + 0.1 from the current entry and the stop loss is -0.1.

datetime Open High Low Close bull count triangle engulf
1 1999-05-28 07:30:00 1.5972 1.5982 1.5964 1.5978 NA NA 0
2 1999-05-28 08:00:00 1.5975 1.5979 1.5959 1.5973 NA NA -10 0
3 1999-05-28 08:30:00 1.5972 1.5994 1.5971 1.5982 NA NA 0
4 1999-05-28 09:00:00 1.5984 1.5999 1.5981 1.5986 NA NA +engulfed
5 1999-05-28 09:30:00 1.5988 1.5999 1.5983 1.5994 NA NA 10
6 1999-05-28 10:00:00 1.5996 1.6000 1.5979 1.5982 NA NA
7 1999-05-28 10:30:00 1.5983 1.5985 1.5962 1.5972 NA NA -10 -engulfed
8 1999-05-28 11:00:00 1.5974 1.5981 1.5962 1.5975 NA NA
9 1999-05-28 11:30:00 1.5977 1.5998 1.5970 1.5997 NA NA
10 1999-05-28 12:00:00 1.5997 1.6020 1.5992 1.6014 NA NA
11 1999-05-28 12:30:00 1.6019 1.6047 1.6014 1.6041 NA NA 10
12 1999-05-28 13:00:00 1.6041 1.6047 1.6005 1.6012 NA NA
13 1999-05-28 13:30:00 1.6012 1.6020 1.6002 1.6007 NA NA
14 1999-05-28 14:00:00 1.6009 1.6010 1.5991 1.6007 NA NA
15 1999-05-28 14:30:00 1.6005 1.6013 1.5996 1.6011 NA NA
16 1999-05-28 15:00:00 1.6012 1.6037 1.6003 1.6037 NA NA 10
17 1999-05-28 15:30:00 1.6036 1.6039 1.6010 1.6021 NA NA
18 1999-05-28 16:00:00 1.6022 1.6023 1.6002 1.6015 NA NA
19 1999-05-28 16:30:00 1.6019 1.6025 1.6004 1.6013 NA NA -10
20 1999-05-28 17:00:00 1.6007 1.6029 1.5997 1.6019 NA NA
21 1999-05-28 17:30:00 1.6025 1.6040 1.6007 1.6022 NA NA +engulfed
22 1999-05-28 18:00:00 1.6021 1.6031 1.6014 1.6024 NA NA 10
23 1999-05-28 18:30:00 1.6028 1.6031 1.5999 1.6009 NA NA -10
24 1999-05-28 19:00:00 1.6012 1.6019 1.6007 1.6011 NA NA
25 1999-05-28 19:30:00 1.6003 1.6017 1.6001 1.6015 NA NA 10
26 1999-05-28 20:00:00 1.6013 1.6015 1.6007 1.6012 NA NA -10
27 1999-05-28 20:30:00 1.6015 1.6015 1.6006 1.6013 NA NA -engulfed
28 1999-05-28 21:00:00 1.6010 1.6018 1.6010 1.6018 NA NA +engulfed

It's hard to provide more guidance without a reproducible example, called a reprex FAQ: What's a reproducible example (`reprex`) and how do I do one?. In this case, it would be a great benefit if the data were in an easier form to work with.

In this case, assuming the data frame is named entry_orders, simply

dput(entry_orders)

and you can cut and paste code that will recreate what you are working with.

Assuming there were one, it would be possible to show how to use mutate(variable = some_variable - lag(some_variable).

I do not know where to begin because I am confused about how to even get this started. its a bit over my head.

In the example, the data frame is called data, whereby data$engulf represents the entry_order as you specified.

Basically as i mentioned if it says +engulfed, it should be a buy order, if it says -engulfed it should be a sell. Everything else can be ignored.

Also, if we have an entry order, i want it to take a profit on the trade at +0.1 from start and exit, or take a loss on the trade at -0.1 and exit. somewhere i need to keep track of overall profit / loss.

what i can think of starting with is

for(x in 2:nrow(data)) {
if (data$engulf = "+engulfed", do something to track a buy position, do nothing)
}

Please run the following command

dput(data)

and cut and paste the results here. Otherwise, all that's possible is to point you to ifelse()

I have a lot of rows so i had to subset.

data1 <- data[1:50,]

data1

dput(data1)

dput(data1)
structure(list(datetime = structure(c(927891000, 927892800, 927894600,
927896400, 927898200, 927900000, 927901800, 927903600, 927905400,
927907200, 927909000, 927910800, 927912600, 927914400, 927916200,
927918000, 927919800, 927921600, 927923400, 927925200, 927927000,
927928800, 927930600, 927932400, 927934200, 927936000, 927937800,
927939600, 927941400, 927943200, 928123200, 928125000, 928126800,
928128600, 928130400, 928132200, 928134000, 928135800, 928137600,
928139400, 928141200, 928143000, 928144800, 928146600, 928148400,
928150200, 928152000, 928153800, 928155600, 928157400), class = c("POSIXct",
"POSIXt"), tzone = ""), Open = c(1.5972, 1.5975, 1.5972, 1.5984,
1.5988, 1.5996, 1.5983, 1.5974, 1.5977, 1.5997, 1.6019, 1.6041,
1.6012, 1.6009, 1.6005, 1.6012, 1.6036, 1.6022, 1.6019, 1.6007,
1.6025, 1.6021, 1.6028, 1.6012, 1.6003, 1.6013, 1.6015, 1.601,
1.601, 1.6014, 1.6029, 1.6024, 1.6023, 1.6021, 1.6018, 1.602,
1.602, 1.6023, 1.6021, 1.6018, 1.6025, 1.6027, 1.602, 1.6024,
1.6024, 1.6027, 1.6028, 1.6026, 1.6029, 1.6035), High = c(1.5982,
1.5979, 1.5994, 1.5999, 1.5999, 1.6, 1.5985, 1.5981, 1.5998,
1.602, 1.6047, 1.6047, 1.602, 1.601, 1.6013, 1.6037, 1.6039,
1.6023, 1.6025, 1.6029, 1.604, 1.6031, 1.6031, 1.6019, 1.6017,
1.6015, 1.6015, 1.6018, 1.6023, 1.6014, 1.6029, 1.6024, 1.6023,
1.6021, 1.6018, 1.6025, 1.6025, 1.6024, 1.6023, 1.6025, 1.603,
1.6027, 1.6026, 1.6024, 1.603, 1.6036, 1.6033, 1.604, 1.6037,
1.6039), Low = c(1.5964, 1.5959, 1.5971, 1.5981, 1.5983, 1.5979,
1.5962, 1.5962, 1.597, 1.5992, 1.6014, 1.6005, 1.6002, 1.5991,
1.5996, 1.6003, 1.601, 1.6002, 1.6004, 1.5997, 1.6007, 1.6014,
1.5999, 1.6007, 1.6001, 1.6007, 1.6006, 1.601, 1.601, 1.6014,
1.6029, 1.6022, 1.6022, 1.6016, 1.6016, 1.6015, 1.602, 1.602,
1.6021, 1.6018, 1.6022, 1.6018, 1.602, 1.6022, 1.602, 1.6021,
1.602, 1.602, 1.6028, 1.6024), Close = c(1.5978, 1.5973, 1.5982,
1.5986, 1.5994, 1.5982, 1.5972, 1.5975, 1.5997, 1.6014, 1.6041,
1.6012, 1.6007, 1.6007, 1.6011, 1.6037, 1.6021, 1.6015, 1.6013,
1.6019, 1.6022, 1.6024, 1.6009, 1.6011, 1.6015, 1.6012, 1.6013,
1.6018, 1.6022, 1.6014, 1.6029, 1.6024, 1.6022, 1.6017, 1.6018,
1.6019, 1.6024, 1.6022, 1.6023, 1.6023, 1.6022, 1.6021, 1.6025,
1.6022, 1.6025, 1.6029, 1.6028, 1.6027, 1.6037, 1.6034), bull = c(NA,
NA, NA, NA, NA, NA, NA, NA, NA, NA, NA, NA, NA, NA, NA, NA, NA,
NA), count = c(NA, NA, NA, NA, NA, NA, NA, NA, NA, NA, NA, NA,
NA, NA, NA, NA, NA, NA, NA, NA, NA, NA, NA, NA, NA, NA, NA, NA,
NA, NA, NA, NA, NA, NA), triangle = c("0", "-10", "", "", "10",
"", "-10", "", "", "", "10", "", "", "", "", "10", "", "", "-10",
"", "", "10", "-10", "", "10", "-10", "", "", "10", "-10", "10",
"", "", "-10", "", "", "10", "-10", "", "", "", "-10", "10",
"-10", "", "10", "", "-10", "10", ""), engulf = c("0", "0", "0",
"+engulfed", "", "", "-engulfed", "", "", "", "", "", "", "",
"", "", "", "", "", "", "+engulfed", "", "", "", "", "", "-engulfed",
"+engulfed", "", "", "", "", "", "", "", "+engulfed", "", "",
"", "", "", "", "", "", "", "+engulfed", "", "", "", "+engulfed"
)), row.names = c(NA, 50L), class = "data.frame")

I changed the +engulf and -engulf so I can better explain what I am trying to do

dput(data1)
structure(list(datetime = structure(c(927891000, 927892800, 927894600,
927896400, 927898200, 927900000, 927901800, 927903600, 927905400,
927907200, 927909000, 927910800, 927912600, 927914400, 927916200,
927918000, 927919800, 927921600, 927923400, 927925200, 927927000,
927928800, 927930600, 927932400, 927934200, 927936000, 927937800,
927939600, 927941400, 927943200, 928123200, 928125000, 928126800,
928128600, 928130400, 928132200, 928134000, 928135800, 928137600,
928139400, 928141200, 928143000, 928144800, 928146600, 928148400,
928150200, 928152000, 928153800, 928155600, 928157400), class = c("POSIXct",
"POSIXt"), tzone = ""), Open = c(1.5972, 1.5975, 1.5972, 1.5984,
1.5988, 1.5996, 1.5983, 1.5974, 1.5977, 1.5997, 1.6019, 1.6041,
1.6012, 1.6009, 1.6005, 1.6012, 1.6036, 1.6022, 1.6019, 1.6007,
1.6025, 1.6021, 1.6028, 1.6012, 1.6003, 1.6013, 1.6015, 1.601,
1.601, 1.6014, 1.6029, 1.6024, 1.6023, 1.6021, 1.6018, 1.602,
1.602, 1.6023, 1.6021, 1.6018, 1.6025, 1.6027, 1.602, 1.6024,
1.6024, 1.6027, 1.6028, 1.6026, 1.6029, 1.6035), High = c(1.5982,
1.5979, 1.5994, 1.5999, 1.5999, 1.6, 1.5985, 1.5981, 1.5998,
1.602, 1.6047, 1.6047, 1.602, 1.601, 1.6013, 1.6037, 1.6039,
1.6023, 1.6025, 1.6029, 1.604, 1.6031, 1.6031, 1.6019, 1.6017,
1.6015, 1.6015, 1.6018, 1.6023, 1.6014, 1.6029, 1.6024, 1.6023,
1.6021, 1.6018, 1.6025, 1.6025, 1.6024, 1.6023, 1.6025, 1.603,
1.6027, 1.6026, 1.6024, 1.603, 1.6036, 1.6033, 1.604, 1.6037,
1.6039), Low = c(1.5964, 1.5959, 1.5971, 1.5981, 1.5983, 1.5979,
1.5962, 1.5962, 1.597, 1.5992, 1.6014, 1.6005, 1.6002, 1.5991,
1.5996, 1.6003, 1.601, 1.6002, 1.6004, 1.5997, 1.6007, 1.6014,
1.5999, 1.6007, 1.6001, 1.6007, 1.6006, 1.601, 1.601, 1.6014,
1.6029, 1.6022, 1.6022, 1.6016, 1.6016, 1.6015, 1.602, 1.602,
1.6021, 1.6018, 1.6022, 1.6018, 1.602, 1.6022, 1.602, 1.6021,
1.602, 1.602, 1.6028, 1.6024), Close = c(1.5978, 1.5973, 1.5982,
1.5986, 1.5994, 1.5982, 1.5972, 1.5975, 1.5997, 1.6014, 1.6041,
1.6012, 1.6007, 1.6007, 1.6011, 1.6037, 1.6021, 1.6015, 1.6013,
1.6019, 1.6022, 1.6024, 1.6009, 1.6011, 1.6015, 1.6012, 1.6013,
1.6018, 1.6022, 1.6014, 1.6029, 1.6024, 1.6022, 1.6017, 1.6018,
1.6019, 1.6024, 1.6022, 1.6023, 1.6023, 1.6022, 1.6021, 1.6025,
1.6022, 1.6025, 1.6029, 1.6028, 1.6027, 1.6037, 1.6034), bull = c(NA,
NA, NA, NA, NA, NA, NA, NA, NA, NA, NA, NA, NA, NA, NA, NA, NA,
NA), count = c(NA, NA, NA, NA, NA, NA, NA, NA, NA, NA, NA, NA,
NA, NA, NA, NA, NA, NA, NA, NA, NA, NA, NA, NA, NA, NA, NA, NA,
NA, NA, NA, NA, NA, NA), triangle = c("0", "-10", "", "", "10",
"", "-10", "", "", "", "10", "", "", "", "", "10", "", "", "-10",
"", "", "10", "-10", "", "10", "-10", "", "", "10", "-10", "10",
"", "", "-10", "", "", "10", "-10", "", "", "", "-10", "10",
"-10", "", "10", "", "-10", "10", ""), engulf = c("0", "0", "0",
"buy @ next open", "", "", "sell @ next open", "", "", "", "",
"", "", "", "", "", "", "", "", "", "buy @ next open", "", "",
"", "", "", "sell @ next open", "buy @ next open", "", "", "",
"", "", "", "", "buy @ next open", "", "", "", "", "", "", "",
"", "", "buy @ next open", "", "", "", "buy @ next open")), row.names = c(NA,
50L), class = "data.frame")

1 Like

Thanks! I've simplified your data to create a 3-column data frame

  1. Your datetime (renamed tradetime)
  2. An "indicator" composed of random numbers
  3. A field "action" based on the indicator in the immediately preceding row

Does this clarify your problem?

suppressPackageStartupMessages(library(dplyr)) 
dat <- structure(list(datetime = structure(c(927891000, 927892800, 927894600,
927896400, 927898200, 927900000, 927901800, 927903600, 927905400,
927907200, 927909000, 927910800, 927912600, 927914400, 927916200,
927918000, 927919800, 927921600, 927923400, 927925200, 927927000,
927928800, 927930600, 927932400, 927934200, 927936000, 927937800,
927939600, 927941400, 927943200, 928123200, 928125000, 928126800,
928128600, 928130400, 928132200, 928134000, 928135800, 928137600,
928139400, 928141200, 928143000, 928144800, 928146600, 928148400,
928150200, 928152000, 928153800, 928155600, 928157400), class = c("POSIXct",
"POSIXt"), tzone = ""), Open = c(1.5972, 1.5975, 1.5972, 1.5984,
1.5988, 1.5996, 1.5983, 1.5974, 1.5977, 1.5997, 1.6019, 1.6041,
1.6012, 1.6009, 1.6005, 1.6012, 1.6036, 1.6022, 1.6019, 1.6007,
1.6025, 1.6021, 1.6028, 1.6012, 1.6003, 1.6013, 1.6015, 1.601,
1.601, 1.6014, 1.6029, 1.6024, 1.6023, 1.6021, 1.6018, 1.602,
1.602, 1.6023, 1.6021, 1.6018, 1.6025, 1.6027, 1.602, 1.6024,
1.6024, 1.6027, 1.6028, 1.6026, 1.6029, 1.6035), High = c(1.5982,
1.5979, 1.5994, 1.5999, 1.5999, 1.6, 1.5985, 1.5981, 1.5998,
1.602, 1.6047, 1.6047, 1.602, 1.601, 1.6013, 1.6037, 1.6039,
1.6023, 1.6025, 1.6029, 1.604, 1.6031, 1.6031, 1.6019, 1.6017,
1.6015, 1.6015, 1.6018, 1.6023, 1.6014, 1.6029, 1.6024, 1.6023,
1.6021, 1.6018, 1.6025, 1.6025, 1.6024, 1.6023, 1.6025, 1.603,
1.6027, 1.6026, 1.6024, 1.603, 1.6036, 1.6033, 1.604, 1.6037,
1.6039), Low = c(1.5964, 1.5959, 1.5971, 1.5981, 1.5983, 1.5979,
1.5962, 1.5962, 1.597, 1.5992, 1.6014, 1.6005, 1.6002, 1.5991,
1.5996, 1.6003, 1.601, 1.6002, 1.6004, 1.5997, 1.6007, 1.6014,
1.5999, 1.6007, 1.6001, 1.6007, 1.6006, 1.601, 1.601, 1.6014,
1.6029, 1.6022, 1.6022, 1.6016, 1.6016, 1.6015, 1.602, 1.602,
1.6021, 1.6018, 1.6022, 1.6018, 1.602, 1.6022, 1.602, 1.6021,
1.602, 1.602, 1.6028, 1.6024), Close = c(1.5978, 1.5973, 1.5982,
1.5986, 1.5994, 1.5982, 1.5972, 1.5975, 1.5997, 1.6014, 1.6041,
1.6012, 1.6007, 1.6007, 1.6011, 1.6037, 1.6021, 1.6015, 1.6013,
1.6019, 1.6022, 1.6024, 1.6009, 1.6011, 1.6015, 1.6012, 1.6013,
1.6018, 1.6022, 1.6014, 1.6029, 1.6024, 1.6022, 1.6017, 1.6018,
1.6019, 1.6024, 1.6022, 1.6023, 1.6023, 1.6022, 1.6021, 1.6025,
1.6022, 1.6025, 1.6029, 1.6028, 1.6027, 1.6037, 1.6034), bull = c(NA,
NA, NA, NA, NA, NA, NA, NA, NA, NA, NA, NA, NA, NA, NA, NA, NA,
NA), count = c(NA, NA, NA, NA, NA, NA, NA, NA, NA, NA, NA, NA,
NA, NA, NA, NA, NA, NA, NA, NA, NA, NA, NA, NA, NA, NA, NA, NA,
NA, NA, NA, NA, NA, NA), triangle = c("0", "-10", "", "", "10",
"", "-10", "", "", "", "10", "", "", "", "", "10", "", "", "-10",
"", "", "10", "-10", "", "10", "-10", "", "", "10", "-10", "10",
"", "", "-10", "", "", "10", "-10", "", "", "", "-10", "10",
"-10", "", "10", "", "-10", "10", ""), engulf = c("0", "0", "0",
"buy @ next open", "", "", "sell @ next open", "", "", "", "",
"", "", "", "", "", "", "", "", "", "buy @ next open", "", "",
"", "", "", "sell @ next open", "buy @ next open", "", "", "",
"", "", "", "", "buy @ next open", "", "", "", "", "", "", "",
"", "", "buy @ next open", "", "", "", "buy @ next open")), row.names = c(NA,
50L), class = "data.frame")

set.seed(42)
indicator <- rnorm(50)
abbr <- dat %>% select(tradetime = datetime)
abbr <- cbind(abbr, indicator)
abbr <- abbr %>% mutate(action = ifelse(abs(lag(indicator < 1.5)), "no action", NA))
abbr <- abbr %>% mutate(action = ifelse(lag(indicator <= -1.5), "sell", action))
abbr <- abbr %>% mutate(action = ifelse(lag(indicator >= 1.5), "buy", action))
abbr
#>              tradetime   indicator    action
#> 1  1999-05-28 04:30:00  1.37095845      <NA>
#> 2  1999-05-28 05:00:00 -0.56469817 no action
#> 3  1999-05-28 05:30:00  0.36312841 no action
#> 4  1999-05-28 06:00:00  0.63286260 no action
#> 5  1999-05-28 06:30:00  0.40426832 no action
#> 6  1999-05-28 07:00:00 -0.10612452 no action
#> 7  1999-05-28 07:30:00  1.51152200 no action
#> 8  1999-05-28 08:00:00 -0.09465904       buy
#> 9  1999-05-28 08:30:00  2.01842371 no action
#> 10 1999-05-28 09:00:00 -0.06271410       buy
#> 11 1999-05-28 09:30:00  1.30486965 no action
#> 12 1999-05-28 10:00:00  2.28664539 no action
#> 13 1999-05-28 10:30:00 -1.38886070       buy
#> 14 1999-05-28 11:00:00 -0.27878877 no action
#> 15 1999-05-28 11:30:00 -0.13332134 no action
#> 16 1999-05-28 12:00:00  0.63595040 no action
#> 17 1999-05-28 12:30:00 -0.28425292 no action
#> 18 1999-05-28 13:00:00 -2.65645542 no action
#> 19 1999-05-28 13:30:00 -2.44046693      sell
#> 20 1999-05-28 14:00:00  1.32011335      sell
#> 21 1999-05-28 14:30:00 -0.30663859 no action
#> 22 1999-05-28 15:00:00 -1.78130843 no action
#> 23 1999-05-28 15:30:00 -0.17191736      sell
#> 24 1999-05-28 16:00:00  1.21467470 no action
#> 25 1999-05-28 16:30:00  1.89519346 no action
#> 26 1999-05-28 17:00:00 -0.43046913       buy
#> 27 1999-05-28 17:30:00 -0.25726938 no action
#> 28 1999-05-28 18:00:00 -1.76316309 no action
#> 29 1999-05-28 18:30:00  0.46009735      sell
#> 30 1999-05-28 19:00:00 -0.63999488 no action
#> 31 1999-05-30 21:00:00  0.45545012 no action
#> 32 1999-05-30 21:30:00  0.70483734 no action
#> 33 1999-05-30 22:00:00  1.03510352 no action
#> 34 1999-05-30 22:30:00 -0.60892638 no action
#> 35 1999-05-30 23:00:00  0.50495512 no action
#> 36 1999-05-30 23:30:00 -1.71700868 no action
#> 37 1999-05-31 00:00:00 -0.78445901      sell
#> 38 1999-05-31 00:30:00 -0.85090759 no action
#> 39 1999-05-31 01:00:00 -2.41420765 no action
#> 40 1999-05-31 01:30:00  0.03612261      sell
#> 41 1999-05-31 02:00:00  0.20599860 no action
#> 42 1999-05-31 02:30:00 -0.36105730 no action
#> 43 1999-05-31 03:00:00  0.75816324 no action
#> 44 1999-05-31 03:30:00 -0.72670483 no action
#> 45 1999-05-31 04:00:00 -1.36828104 no action
#> 46 1999-05-31 04:30:00  0.43281803 no action
#> 47 1999-05-31 05:00:00 -0.81139318 no action
#> 48 1999-05-31 05:30:00  1.44410126 no action
#> 49 1999-05-31 06:00:00 -0.43144620 no action
#> 50 1999-05-31 06:30:00  0.65564788 no action

Created on 2020-01-22 by the reprex package (v0.3.0)
First, I would like to say thank you for even taking the time to assist.

What you did was useful in that it taught me how to manipulate a column within a data frame i did not know that it could be done so efficiently before.

Now that we have the actions within the columns, my original problem is okay now I know what I want it to do, but how can i track the profits or losses of those actions. for example if the action is buy, i would like to either take a profit when any high achieves greater than 0.1 from its starting entry for example if we buy at 1.6000, the profit should be taken at 1.61 leaving a profit of 0.1 and somehow track that over time and similary if it does not hit the profit target, but instead a low sometime in the future hits -0.1 from the inital value, this would be 1.59, it should record that as a loss and track that as well.

I hope i am writing this out clearly. please let me know if i could do a better job describing.

Glad that helped.

If I'm correctly understanding, the steps are

  1. Each day, buy if previous day's high exceeds a target
  2. Put into position
  3. If in position, sell if outside collar
  4. If sell, record P/L

Unclear is whether you add to position on days where high increased within the cap on the prior day. Let's say prices move by a bond tick

tick <- 1/32
floor <- -tick*36
cap <- tick*36
seq(floor,cap,tick)[2:72]
#>  [1] -1.09375 -1.06250 -1.03125 -1.00000 -0.96875 -0.93750 -0.90625 -0.87500
#>  [9] -0.84375 -0.81250 -0.78125 -0.75000 -0.71875 -0.68750 -0.65625 -0.62500
#> [17] -0.59375 -0.56250 -0.53125 -0.50000 -0.46875 -0.43750 -0.40625 -0.37500
#> [25] -0.34375 -0.31250 -0.28125 -0.25000 -0.21875 -0.18750 -0.15625 -0.12500
#> [33] -0.09375 -0.06250 -0.03125  0.00000  0.03125  0.06250  0.09375  0.12500
#> [41]  0.15625  0.18750  0.21875  0.25000  0.28125  0.31250  0.34375  0.37500
#> [49]  0.40625  0.43750  0.46875  0.50000  0.53125  0.56250  0.59375  0.62500
#> [57]  0.65625  0.68750  0.71875  0.75000  0.78125  0.81250  0.84375  0.87500
#> [65]  0.90625  0.93750  0.96875  1.00000  1.03125  1.06250  1.09375

Created on 2020-01-22 by the reprex package (v0.3.0)

Would you add to position within the collar? That's a wrinkle, so I'll assume that no new trades will occur within the collar.

The next problem is trade matching. I'm assuming we're dealing with a single instrument, of course.

My previous example implicitly assumes within-collar additions, but it will serve to illustrate an approach.


suppressPackageStartupMessages(library(dplyr)) 
abbr <- structure(list(tradetime = structure(c(927891000, 927892800, 
927894600, 927896400, 927898200, 927900000, 927901800, 927903600, 
927905400, 927907200, 927909000, 927910800, 927912600, 927914400, 
927916200, 927918000, 927919800, 927921600, 927923400, 927925200, 
927927000, 927928800, 927930600, 927932400, 927934200, 927936000, 
927937800, 927939600, 927941400, 927943200, 928123200, 928125000, 
928126800, 928128600, 928130400, 928132200, 928134000, 928135800, 
928137600, 928139400, 928141200, 928143000, 928144800, 928146600, 
928148400, 928150200, 928152000, 928153800, 928155600, 928157400
), class = c("POSIXct", "POSIXt"), tzone = ""), indicator = c(1.37095844714667, 
-0.564698171396089, 0.363128411337339, 0.63286260496104, 0.404268323140999, 
-0.106124516091484, 1.51152199743894, -0.0946590384130976, 2.01842371387704, 
-0.062714099052421, 1.30486965422349, 2.28664539270111, -1.38886070111234, 
-0.278788766817371, -0.133321336393658, 0.635950398070074, -0.284252921416072, 
-2.65645542090478, -2.44046692857552, 1.32011334573019, -0.306638594078475, 
-1.78130843398, -0.171917355759621, 1.2146746991726, 1.89519346126497, 
-0.4304691316062, -0.25726938276893, -1.76316308519478, 0.460097354831271, 
-0.639994875960119, 0.455450123241219, 0.704837337228819, 1.03510352196992, 
-0.608926375407211, 0.50495512329797, -1.71700867907334, -0.784459008379496, 
-0.850907594176518, -2.41420764994663, 0.0361226068922556, 0.205998600200254, 
-0.361057298548666, 0.758163235699517, -0.726704827076575, -1.36828104441929, 
0.432818025888717, -0.811393176186672, 1.44410126172125, -0.431446202613345, 
0.655647883402207), action = c(NA, "no action", "no action", 
"no action", "no action", "no action", "no action", "buy", "no action", 
"buy", "no action", "no action", "buy", "no action", "no action", 
"no action", "no action", "no action", "sell", "sell", "no action", 
"no action", "sell", "no action", "no action", "buy", "no action", 
"no action", "sell", "no action", "no action", "no action", "no action", 
"no action", "no action", "no action", "sell", "no action", "no action", 
"sell", "no action", "no action", "no action", "no action", "no action", 
"no action", "no action", "no action", "no action", "no action"
)), class = "data.frame", row.names = c(NA, -50L))

trades <- abbr %>% filter(action != "no action")
trades
#>              tradetime   indicator action
#> 1  1999-05-28 08:00:00 -0.09465904    buy
#> 2  1999-05-28 09:00:00 -0.06271410    buy
#> 3  1999-05-28 10:30:00 -1.38886070    buy
#> 4  1999-05-28 13:30:00 -2.44046693   sell
#> 5  1999-05-28 14:00:00  1.32011335   sell
#> 6  1999-05-28 15:30:00 -0.17191736   sell
#> 7  1999-05-28 17:00:00 -0.43046913    buy
#> 8  1999-05-28 18:30:00  0.46009735   sell
#> 9  1999-05-31 00:00:00 -0.78445901   sell
#> 10 1999-05-31 01:30:00  0.03612261   sell

Created on 2020-01-22 by the reprex package (v0.3.0)

Can you see how you'd use mutate with lag to calculate p/l on each pair of buy/sells?

The steps should be as follows

  1. If the action column says buy or sell, perform that action on the open of the following day
  2. Once an action is taken, let’s say the action is buy in this example, execute the action to close the order if price moves +0.1or -0.1 from the entry position
  3. Record whether the trade closed in profit or closed in loss.

I hope that clears my logic up.

Sorry not following day I mean the open of the next row in the data frame.

Also in order to track profits and losses, we should look at the highs and lows of each day and see if they meet that criteria.

Here is an example I’ll type out.

High Low Open Close. Action
1.2043 1.1999 1.2025 1.2024. Buy
1.2060 1.2020. 1.2024(B). 1.2050. No action
1.2134(c) 1.2000. 1.2051. 1.2099

Where (B) represents where the buy order is executed.
And (C) represents where the order was closed because 1.2134 - 1.2024 = + 0.11 which is greater than the +0.1 target we wanted to hit.

The order should calculate profit from the open 1.2024 + 0.1 = 1.2124. Leaving overall profit at 0.1.

At this point, I have to challenge you to try a reprex to move the discussion forward.

1 Like

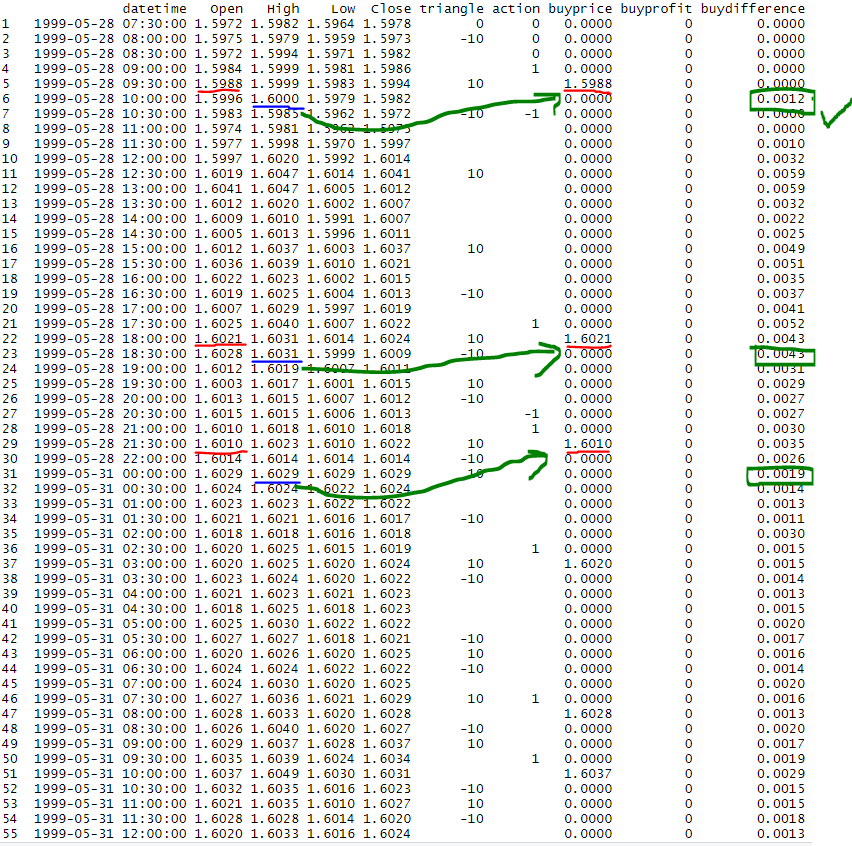
Here is an image of the results of the current output that i see. The items highlighted in red is just a copy over of the open to represent buyprice. The buy difference that you see should be the difference between the high that is greater than at least 0.001. It works for the first one but it does not work for any of the next following ones. The area highlighted in blue occurs where the buy price is at least 0.001 from the different buy prices.

I'm not sure how to do a reprex, i tried to install the packages to do so.

So here is all my code below
#>
library(dplyr)
install.packages("reprex")
install.packages("tidyverse")

the point of this code is to tell us when the high or low points become engulfed

one candle later.

load data

data <- read.csv("C:/Users/Adrian/Documents/GBPUSD30-2-converteddates.csv", header = T)

str() function displays the structure of the vectors within the data set

str(data)
datetime <- as.POSIXct(paste(data$Date,data$Time), format = "%m/%d/%Y %H:%M")
#in the above, we took the date and time factors and pasted them together
datetime
str(datetime)

this creates a new column in R and assigns the vector datetime to that column

data$datetime <- datetime
data

delete out columns that I do not need

data$bull <- NULL
data$count <- NULL
data$Date <- NULL
data$Time <- NULL
data$engulf <- NULL
data <- data[ , c(5,1,2,3,4)]
data

addition of columns that i need for my calculation

data$triangle <- 0
data$action <- 0

for(z in 2:nrow(data)){
ifelse (((data[z,]$Close > data[z+1,]$Close)&(data[z,]$Close > data[z-1,]$Close)), data$triangle[z] <- 10,
ifelse(((data[z,]$Close < data[z+1,]$Close)&(data[z,]$Close < data[z-1,]$Close)), data$triangle[z] <- -10, data$triangle[z] <- "")

)
}
data

for (a in 2:nrow(data)){

ifelse(((data[a,]$triangle == 10)& (data[a+2,]$Low < data[a+1,]$Low) & (data[a+2,]$Low < data[a-1,]$Low)), data$action[a+2] <- "-1",
ifelse(((data[a,]$triangle == -10)& (data[a+2,]$High > data[a+1,]$High) & (data[a+2,]$High > data[a-1,]$High)), data$action[a+2] <- "1", data$action[a+2] <- "")

)
}
data
here i am trying to calculate the profits based on the action column

#lets attempt to do the buy price open

data$buyprice <- 0
data

for (b in 2:nrow(data)){

if(data$action[b] == 1){
data$buyprice[b+1] = data$Open[b+1]
}

}

data$buydifference <- 0
data
RandomNumber <- 5000
execute = 1

##y <- nrow(data)
##buydifference1 <- rep(0,y)
##buydifference1

##for(row in 1:y-1){
#compute this one buy difference

buydifference1[row] <- max(data$high[row:y] - data$buyprice[row:y], 0)

##}

##buydifference1

data

for (c in 2:nrow(data)){

if (data$buyprice[c] > 0){

data$buydifference[c] <- "Happy"

for (x in 1:RandomNumber){

 if ((data$High[c+x] - data$buyprice[c] > 0.001) && (execute = 1)) {


     if (execute > 0) {
        data$buydifference[c+x] = data$High[c+x] - data$buyprice[c] 
        execute <- -1
        
        }
      else {
        next()
      }
      
  }
 
}

}

}

This topic was automatically closed 21 days after the last reply. New replies are no longer allowed.