Hi Helping Hands,
I am trying to plot figure as attached. Looking for your support to get a plot, mainly facing issue with dynamic upper and lower margin.
I have a Dummy Case:
- Conducted a clinical study and physiologically based pharmacokinetic (PBPK) simulation to evaluate a potential drug-drug interaction.
Outcome: - Clinically Observed: AUC treated to AUC control Ratio: 1.10
- PBPK Predicted AUC treated to AUC control Ratio: 1.20
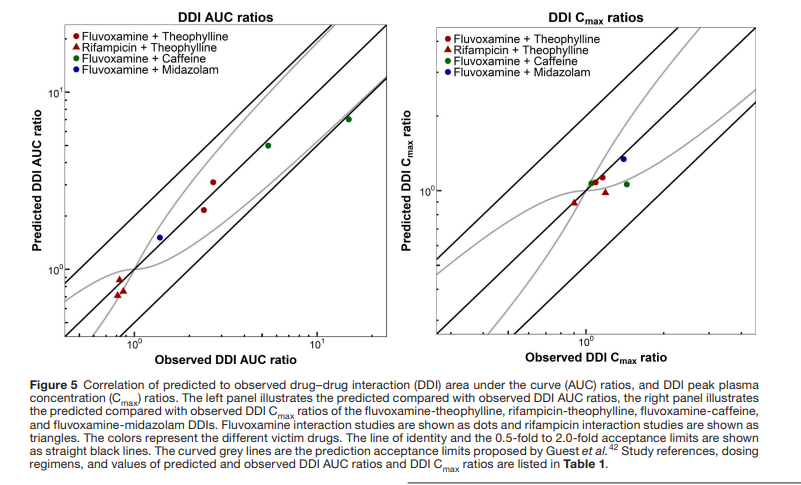
To assess the accuracy and relevance of the prediction, I want to generate a plot comparing the observed and predicted AUC ratios. The plot should include:
- Identity Line: Represents perfect prediction (Observed = Predicted).
- 2-Fold Error Margins: Upper and lower bounds at ±2-fold deviation from the identity line.
- Dynamic Boundaries (need to be cheeked):
- Limit is calculated using the formula:
Limit=[Variability+2×(Observed AUC Ratio−1)]/Observed AUC Ratio - Dynamic Upper Bound = Limit × Observed AUC Ratio
- Dynamic Lower Bound = Limit ÷ Observed AUC Ratio
- Limit is calculated using the formula:
For this case:
- Variability is set to 1.25, and Observed AUC Ratio = 1, the dynamic bounds align with the standard bioequivalence limits of 0.80 to 1.25, which corresponds to the conventional ±20% range used in bioequivalence testing.
- If Variability = 1, it implies no variability, and the dynamic bounds collapse to the identity line.
I am seeking your support to plot as figure.