Dear all,
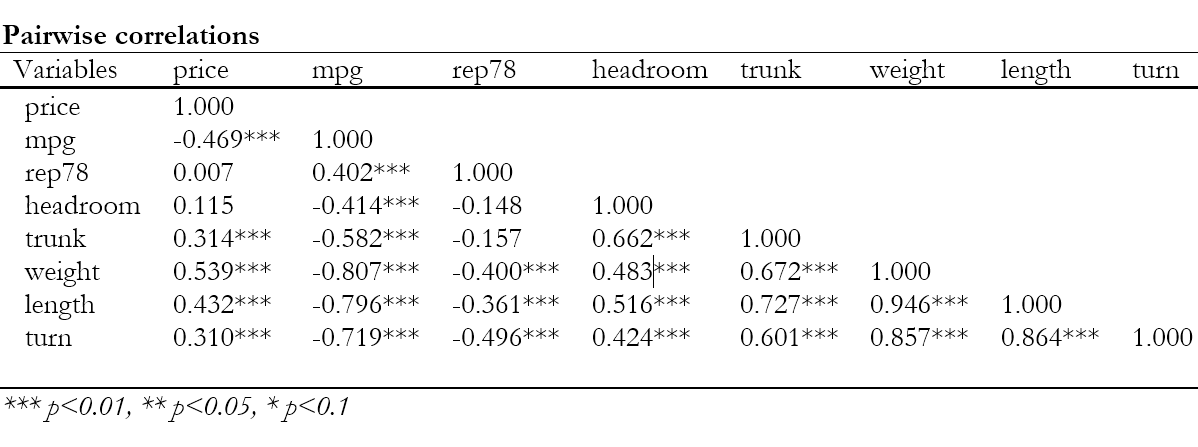
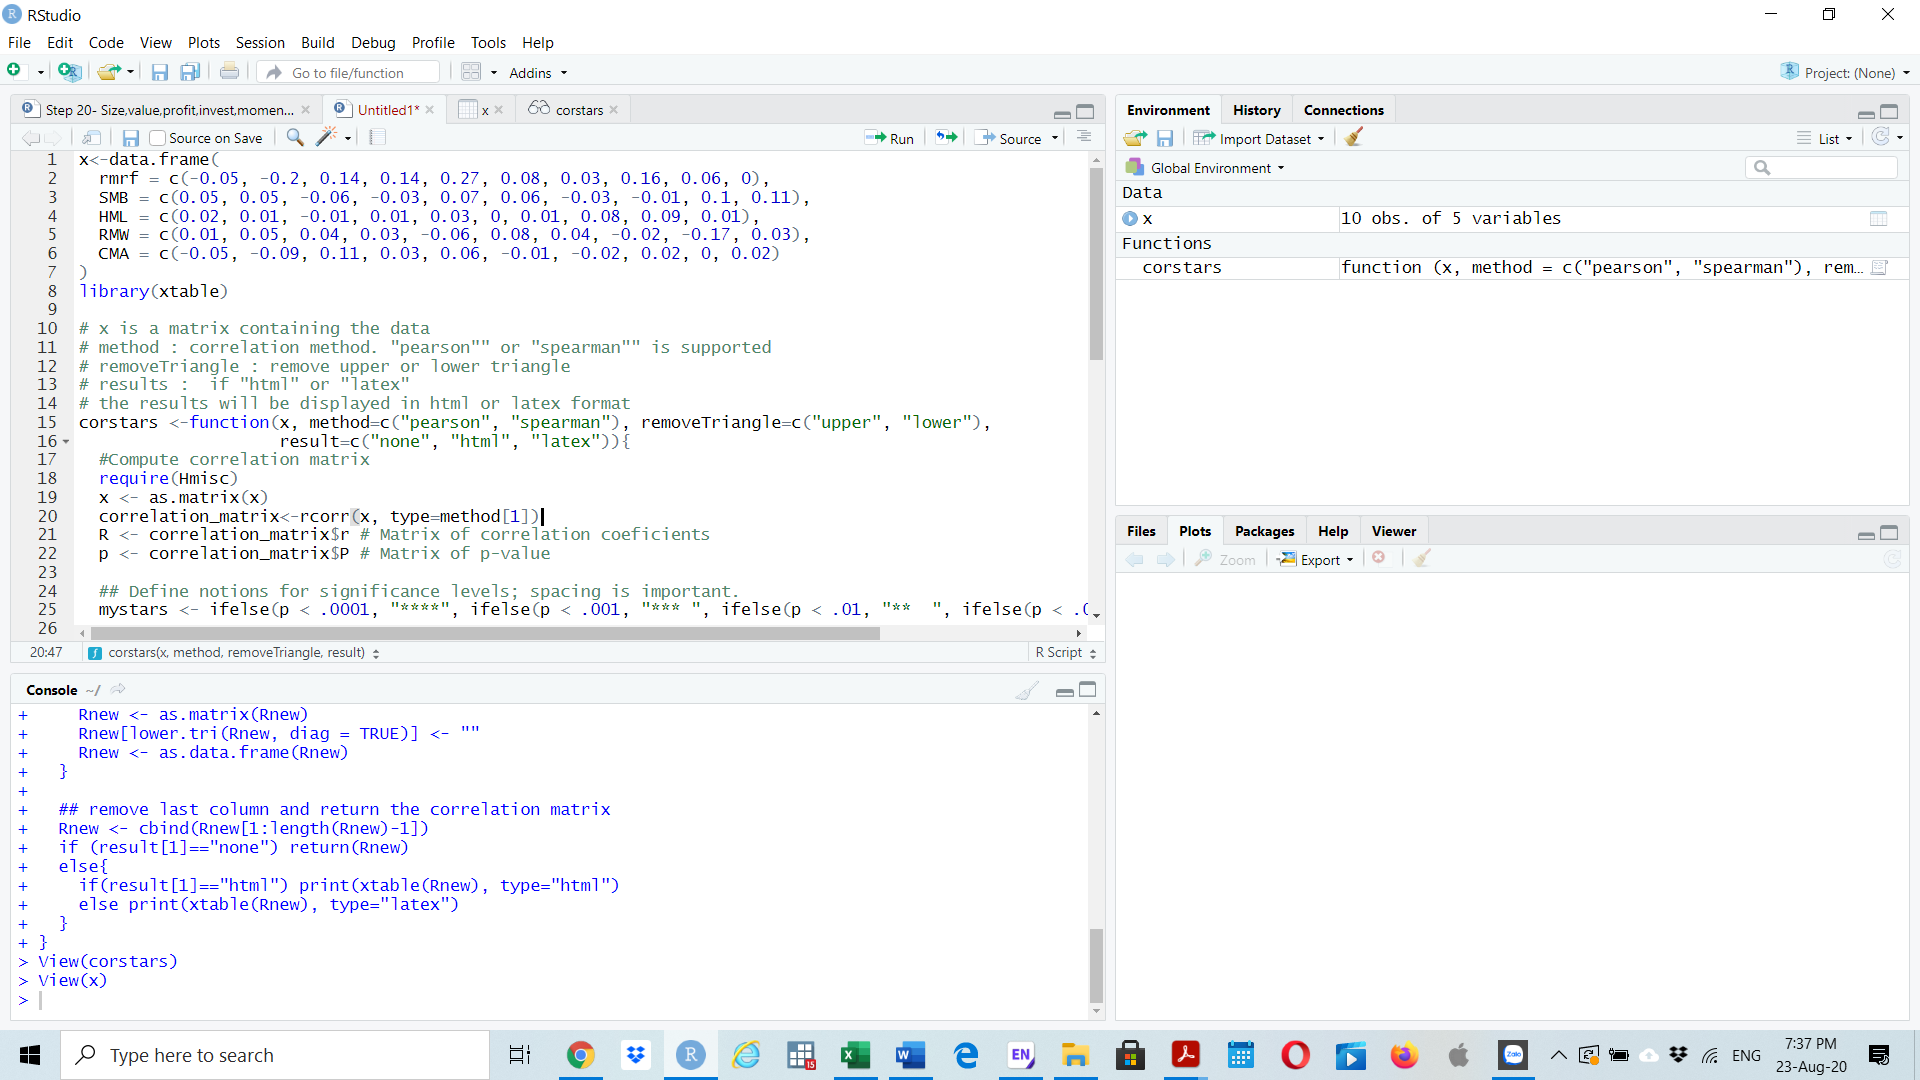
I have a data set like that and I would like to create a correlation matrix that has coefficients and significance levels as asterisks (,,). I apply this code below but it doesn't work.
I would like to ask for help.
Thank you in advance.
x<-data.frame(
        rmrf = c(-0.05, -0.2, 0.14, 0.14, 0.27, 0.08, 0.03, 0.16, 0.06, 0),
         SMB = c(0.05, 0.05, -0.06, -0.03, 0.07, 0.06, -0.03, -0.01, 0.1, 0.11),
         HML = c(0.02, 0.01, -0.01, 0.01, 0.03, 0, 0.01, 0.08, 0.09, 0.01),
         RMW = c(0.01, 0.05, 0.04, 0.03, -0.06, 0.08, 0.04, -0.02, -0.17, 0.03),
         CMA = c(-0.05, -0.09, 0.11, 0.03, 0.06, -0.01, -0.02, 0.02, 0, 0.02)
)
# x is a matrix containing the data
# method : correlation method. "pearson"" or "spearman"" is supported
# removeTriangle : remove upper or lower triangle
# results :  if "html" or "latex"
  # the results will be displayed in html or latex format
corstars <-function(x, method=c("pearson", "spearman"), removeTriangle=c("upper", "lower"),
                     result=c("none", "html", "latex")){
    #Compute correlation matrix
    require(Hmisc)
    x <- as.matrix(x)
    correlation_matrix<-rcorr(x, type=method[1])
    R <- correlation_matrix$r # Matrix of correlation coeficients
    p <- correlation_matrix$P # Matrix of p-value

    ## Define notions for significance levels; spacing is important.
    mystars <- ifelse(p < .0001, "****", ifelse(p < .001, "*** ", ifelse(p < .01, "**  ", ifelse(p < .05, "*   ", "    "))))

    ## trunctuate the correlation matrix to two decimal
    R <- format(round(cbind(rep(-1.11, ncol(x)), R), 2))[,-1]

    ## build a new matrix that includes the correlations with their apropriate stars
    Rnew <- matrix(paste(R, mystars, sep=""), ncol=ncol(x))
    diag(Rnew) <- paste(diag(R), " ", sep="")
    rownames(Rnew) <- colnames(x)
    colnames(Rnew) <- paste(colnames(x), "", sep="")

    ## remove upper triangle of correlation matrix
    if(removeTriangle[1]=="upper"){
      Rnew <- as.matrix(Rnew)
      Rnew[upper.tri(Rnew, diag = TRUE)] <- ""
      Rnew <- as.data.frame(Rnew)
    }

    ## remove lower triangle of correlation matrix
    else if(removeTriangle[1]=="lower"){
      Rnew <- as.matrix(Rnew)
      Rnew[lower.tri(Rnew, diag = TRUE)] <- ""
      Rnew <- as.data.frame(Rnew)
    }

    ## remove last column and return the correlation matrix
    Rnew <- cbind(Rnew[1:length(Rnew)-1])
    if (result[1]=="none") return(Rnew)
    else{
      if(result[1]=="html") print(xtable(Rnew), type="html")
      else print(xtable(Rnew), type="latex")
    }
}