hello
I work on microbiome data, I hope to know how to make a correlation between taxa (taxa at both axis) and plot the heatmap?

I think you want to use the corrplot package. Below I invented some data and plotted something similar to the image in your post.
MAT <- matrix(runif(100), nrow = 10)
dimnames(MAT) <- list(1:10, LETTERS[1:10])
MAT
#>              A         B          C         D         E          F
#> 1  0.951871830 0.4707230 0.24012347 0.5178127 0.2751222 0.65647700
#> 2  0.766769950 0.4421385 0.72756865 0.6000250 0.6886033 0.08601883
#> 3  0.647124767 0.6931287 0.26635338 0.2746420 0.7660176 0.48235816
#> 4  0.499733644 0.9299283 0.42957249 0.1024356 0.2939042 0.52092845
#> 5  0.970613548 0.5735708 0.05879489 0.8314679 0.8373080 0.69686842
#> 6  0.008677355 0.4761688 0.17473159 0.1486382 0.1598893 0.54540963
#> 7  0.324621430 0.8799219 0.32655718 0.3784643 0.7283856 0.30937435
#> 8  0.073627392 0.7993703 0.16689176 0.3884813 0.8852432 0.03588564
#> 9  0.983724692 0.6937437 0.87019572 0.6012237 0.8342834 0.94695733
#> 10 0.293158099 0.9222931 0.60094841 0.6124042 0.3541667 0.33163832
#>             G          H          I          J
#> 1  0.09200775 0.76309546 0.13565620 0.37810932
#> 2  0.15180410 0.75461615 0.08698062 0.31700478
#> 3  0.76680345 0.05135721 0.26739959 0.51625269
#> 4  0.87011836 0.30710263 0.92486552 0.01055717
#> 5  0.29454072 0.20666723 0.71695770 0.54783177
#> 6  0.98862719 0.76485283 0.92898327 0.16165668
#> 7  0.23338760 0.93043452 0.53492993 0.19314480
#> 8  0.37142818 0.04864177 0.04366780 0.20415356
#> 9  0.07701437 0.75130079 0.91461568 0.84231710
#> 10 0.03610030 0.58653198 0.46372324 0.07806065
CorMat <- cor(MAT, MAT)
corrplot::corrplot(CorMat, method = "color")

Created on 2019-11-08 by the reprex package (v0.3.0.9000)
Thank you i know understand how the correlation plot is drawn
My data resemble that data, i fallowed the instruction of corrplot package, i get a correlation between data of columns(as you illustrated) but i want to make a correlation between data of raws
I have 100taxa(100raws) and 22column
I would transpose the matrix with the t() function.
MAT <- matrix(runif(100), nrow = 10)
dimnames(MAT) <- list(LETTERS[1:10], 1:10)
head(MAT)
#>            1          2         3         4         5          6         7
#> A 0.18892224 0.30293810 0.6510487 0.3393431 0.3139483 0.66755333 0.8467336
#> B 0.12822771 0.88616629 0.1048321 0.3604074 0.2906694 0.34858701 0.1845633
#> C 0.66257674 0.96237661 0.4913882 0.2630195 0.3568480 0.14047893 0.6336629
#> D 0.08658182 0.52588874 0.6831611 0.1584937 0.3575360 0.01207774 0.2514396
#> E 0.44963824 0.24389143 0.2422095 0.2968011 0.2788004 0.48631095 0.7054812
#> F 0.30115486 0.01686491 0.4021860 0.6360747 0.7782060 0.78056557 0.4583389
#>            8          9        10
#> A 0.07322192 0.02385816 0.1008142
#> B 0.45646487 0.30320813 0.8876987
#> C 0.16846586 0.60985360 0.4392490
#> D 0.77025538 0.53005229 0.8712427
#> E 0.35058374 0.32530025 0.8128966
#> F 0.10074519 0.96814106 0.7126357
MAT_trans <- t(MAT)
head(MAT_trans)
#>           A         B         C          D         E          F         G
#> 1 0.1889222 0.1282277 0.6625767 0.08658182 0.4496382 0.30115486 0.7975012
#> 2 0.3029381 0.8861663 0.9623766 0.52588874 0.2438914 0.01686491 0.5838637
#> 3 0.6510487 0.1048321 0.4913882 0.68316112 0.2422095 0.40218605 0.4272772
#> 4 0.3393431 0.3604074 0.2630195 0.15849372 0.2968011 0.63607473 0.9133669
#> 5 0.3139483 0.2906694 0.3568480 0.35753603 0.2788004 0.77820598 0.2557590
#> 6 0.6675533 0.3485870 0.1404789 0.01207774 0.4863110 0.78056557 0.8963948
#>            H         I          J
#> 1 0.58418574 0.5788821 0.47426550
#> 2 0.47522843 0.4997649 0.51553313
#> 3 0.40586512 0.2824922 0.28249560
#> 4 0.88193416 0.6029224 0.88035809
#> 5 0.01977297 0.1195198 0.55975278
#> 6 0.36951783 0.5678245 0.01702115
CorMat <- cor(MAT_trans, MAT_trans)
corrplot::corrplot(CorMat, method = "color")
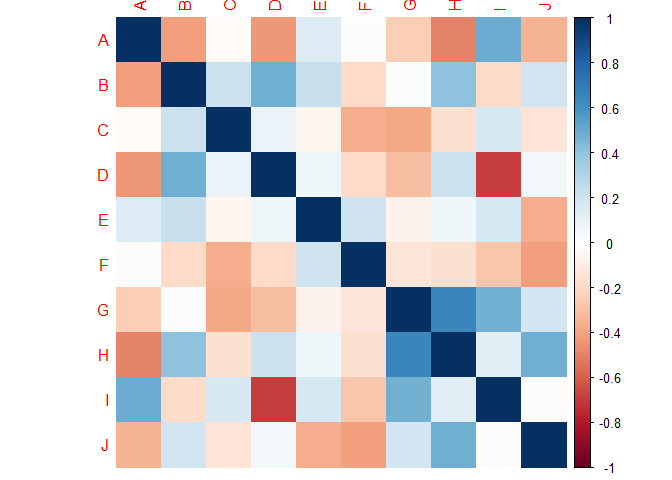
Created on 2019-11-08 by the reprex package (v0.3.0.9000)
Very useful, i will try
Thank you

There are many functions for manipulating strings in R. One example is the stringr package that is part of the tidyverse. In the example below, I take a vector where each element is two words and I change it to keep only the first word of each element. The regular expression "^[:alpha:]+" means: "from the start of the text, look for one or more alphabetic characters". A space is not an alphabetic character, so the function searches up to the first space. Perhaps this will work for your needs.
library(stringr)
#> Warning: package 'stringr' was built under R version 3.5.3
NAMES <- c("Aera Mowaslkd", "Ciouc Lsieldkdfj", "Duionecd Ldfosd ")
NAMES <- str_extract(NAMES, "^[:alpha:]+")
NAMES
#> [1] "Aera"     "Ciouc"    "Duionecd"
Created on 2019-11-09 by the reprex package (v0.3.0.9000)