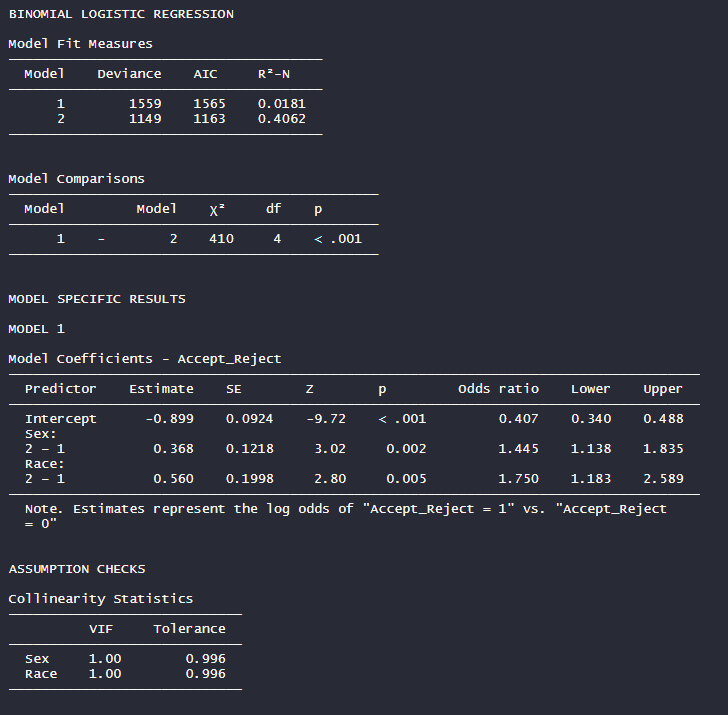
I have been using the Jamovi package ("jmv") to do logistic regression in R since it's the best package I've found so far. The printouts of the tables and models are absoltely beautiful and it has a bunch of good details and customization options (see attached pic). However, the problem is that the models are not saved as a data frame, but instead as a Value with the tagline "Object containing active binding". So I haven't found a way to export the results to word or excel yet.
Does anyone know how I can easily get the printout of this model exported out of R?
That mostly works. I just tried capture.output(), and it allowed me to transform exactly what I have in the picture into a data frame. However, I when I use write.xlsx() to create a spreadsheet from it, everything is in CSV format. In other words, the tables appear nicely in excel, but each row in the table is mushed into a single cell. Looks like this for example:
[1] Model 1 Model X^2 df p
[2] 1 - 2 410 4 <.001
What I was really hoping to do was to be able to write this to an excel sheet and having it as a perfect table there I could paste into word, with next to no effort on my end to then make it APA format. As is though, I'd have to re-write every number again, just the same as if I did by hand without capture.output*() Any ideas on how to get it printed out like a table?
some of the output can be turned into data frames, yes, but not all of it. Unfortunately the one part I'm interested in, the big table of coefficients (i.e. the table it would be the most work to build by hand) is the thing that can't be manipulated with as.data.frame(). Using that command on the results$models array returns an error.
Fantastic, that worked! Thanks!
Turns out you have to add $coef to get the coefficients table, and you specify the block/model by changing the number in the brackets. For anyone else interested, I was able to transform the full second block/model into a table with the following: