Sure, no problem:
library(gstat)
library(movecost)
library(raster)
library(sf)
medmap=raster("//Users/Tony/Documents/PhD/Cardiff/QGIS/Own Layers/Cropped Maps/Elevation Italy and Spain.tif")
Carthago Nova Lat and Long
cn_lat <- -0.9834109
cn_long <- 37.60254
Saguntum Lat and Long
sag_lat <- -0.2761548
sag_long <- 39.67878
orig_points <- SpatialPoints(coords = cbind(cn_lat,cn_long))
dest_points <- SpatialPoints(coords = cbind(sag_lat,sag_long))
movecost(
dtm = medmap, #
origin= orig_points, #
destin = dest_points,#
studyplot = NULL, #
barrier = NULL, # A barrier can be added to prevent a route from passing through
plot.barrier = FALSE,# Works with above
irregular.dtm = TRUE,# Indicates an irregular DTM with coastlines and helps prevent attempts to cross water
funct = "t", # t for Toblers on-path hiking function, pcf for Pandolf with Santee correction
time = "h", # Cost in hours or minutes
outp = "c", # Output in Raster or Contours
move = 16, # number of cell connections 4 (rooks case), 8 (queens), 16 (Knight)
field = 0, # value assigned to cells coinciding with barrier (0 by default)
cogn.slp = FALSE, # Cognitive slope, allow choice of route based on hikers perceived, not actual, slope
sl.crit = 10, # Critical slope (in percent). Used by wheeled vehicle cost function
W = 70, # Walkers body weight Kg
L = 46, # Carried load weight in Kg, 46 - heavy infantry, 32 - Balearic
N = 1.20, # Terrain difficulty
V = 0, # set to 0 to allow slope to effect speed
z = 9, # Zoom level for elevation data (9 by default)
return.base = FALSE, # Optional calculation of return route in dotted line
rb.lty = 2, # Type of line used in return.base
breaks = NULL, # Contour interval, if none specified then 1/10 of cost surface used
cont.lab = TRUE, # Optional labeling of contours
destin.lab = TRUE, # Optional labeling of cost at destination
cex.breaks = 0.6, # Set size of cost labels
cex.lcp.lab = 0.6, # Set size of least cost path labels
graph.out = TRUE, # To generate graphical output
transp = 0.5, # Set transparency of slopeshade raster
oneplot = FALSE, # Set if plots to appear in single window
export = FALSE # Can have results exported as GeoTiff file
)
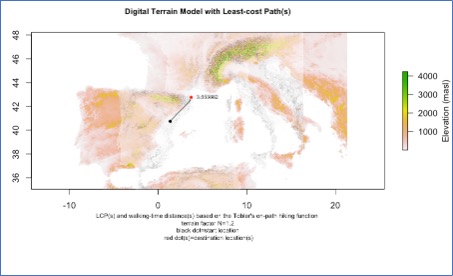
Not sure if the image will appear but its below, label at end point should be hh:mm:ss but its coming out as a decimal due to being a geographic rather than a presentation layer.

