Data structure and data presentation are separate. Try this
library(fpp3)
#> ── Attaching packages ──────────────────────────────────────────── fpp3 0.4.0 ──
#> ✔ tibble      3.1.8      ✔ tsibble     1.1.3
#> ✔ dplyr       1.0.10     ✔ tsibbledata 0.4.1
#> ✔ tidyr       1.3.0      ✔ feasts      0.3.0
#> ✔ lubridate   1.9.1      ✔ fable       0.3.2
#> ✔ ggplot2     3.4.0
#> ── Conflicts ───────────────────────────────────────────────── fpp3_conflicts ──
#> ✖ lubridate::date()    masks base::date()
#> ✖ dplyr::filter()      masks stats::filter()
#> ✖ tsibble::intersect() masks base::intersect()
#> ✖ tsibble::interval()  masks lubridate::interval()
#> ✖ dplyr::lag()         masks stats::lag()
#> ✖ tsibble::setdiff()   masks base::setdiff()
#> ✖ tsibble::union()     masks base::union()
series <- ts(mtcars$mpg, frequency = 12, start = c(2000, 5))
series <- as_tsibble(series)
autoplot(series)
#> Plot variable not specified, automatically selected `.vars = value`
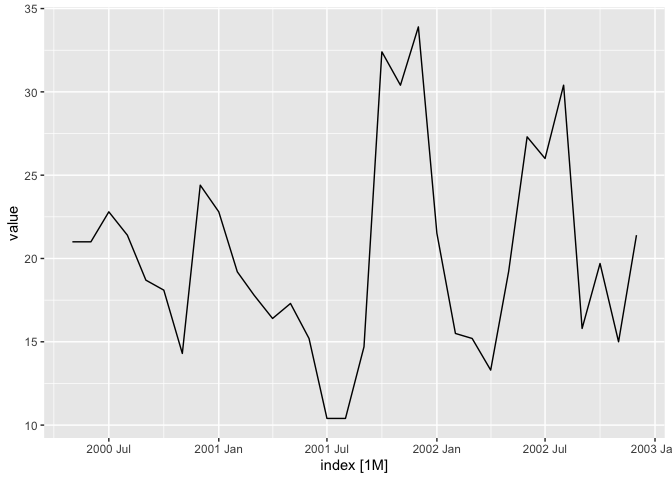
Created on 2023-01-27 with reprex v2.0.2
If you need help using your data, you can use a a reprex. See the FAQ. That will make it easier to attract answers because all that is required to bring in the data will be a cut-and-paste.
Practice tip: save long descriptive variable names for table column labels in presentation. For analysis use shorter names, such as
colnames(my_data) <- c("dated","maize_exp","rain","temp","exch_rate","maize_price","fdi","gdp","oil","inflation")
At print time, use packages like {gt} or save a copy of the source names and then restore
header <- colnames(my_data)
colnames(my_data) <- c("dated","maize_exp","rain","temp","exch_rate","maize_price","fdi","gdp","oil","inflation")
# do some analysis
# restore original
colnames( my_data) <- header