Converting data frame to time series

Hi everyone! May someone please assist me in converting a data frame dataset into time series. My dataset is a typical time series data set with date, export quantity, gdp, fdi etc. I've uploaded the appropriate packages required to import the excel file (readxl), I've used the as.Date function to ensure R knows my date is a date, however, after using the as.ts function accordingly, the date column in the newly converted time series data set is just a series of numbers and not a date anymore. HELP!!
Below is the dataset in data frame format prior to converting it.

# A tibble: 252 x 10
   Date                `Maize Exports (m/t)` `Rainfall (mm)` `Temperature ©` `Exchange rate (R/$)` `Maize price (R)` `FDI (Million R)` GDP (Million~1 Oil p~2 Infla~3
   <dttm>                              <dbl>           <dbl>           <dbl>                 <dbl>             <dbl>             <dbl>          <dbl>   <dbl>   <dbl>
 1 2000-05-01 00:00:00                 21000            30.8            14.4                0.144               678.              4337           9056    192.     5.1
 2 2000-06-01 00:00:00                 54000            14.9            14.0                0.147               583.             -4229           9056    205.     5.1
 3 2000-07-01 00:00:00                134000            11.1            12.6                0.144               518.             -4229           8841    196.     5.9
 4 2000-08-01 00:00:00                213000             6.1            15.3                0.143               526.             -4229           8841    205.     6.8
 5 2000-09-01 00:00:00                123000            38.5            17.8                0.138               576.              6315           8841    234.     6.8
 6 2000-10-01 00:00:00                 94000            61.9            20.1                0.132               636.              6315           4487    231.     7.1
 7 2000-11-01 00:00:00                192000            93.9            19.9                0.129               685.              6315           4487    250.     7.1
 8 2000-12-01 00:00:00                134000            85.6            22.3                0.132               747.             -2143           4487    192.     7  
 9 2001-01-01 00:00:00                133000            92.4            23.4                0.0875             1066.             -5651           7365    226.     5  
10 2001-02-01 00:00:00                168000            51              22.0                0.0879             1042.             -5651           7365    233.     5.9

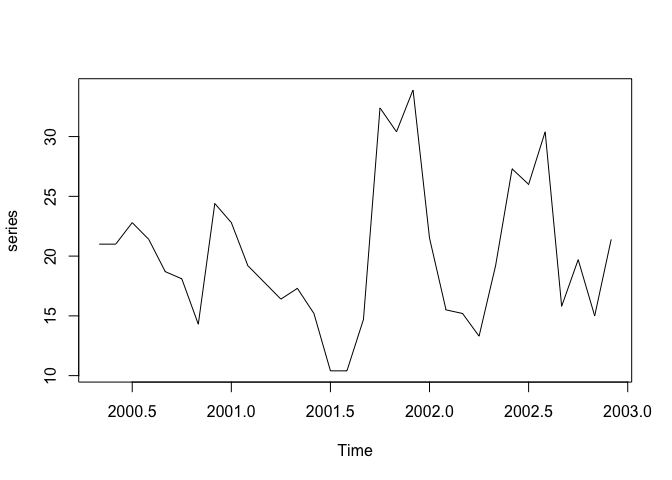
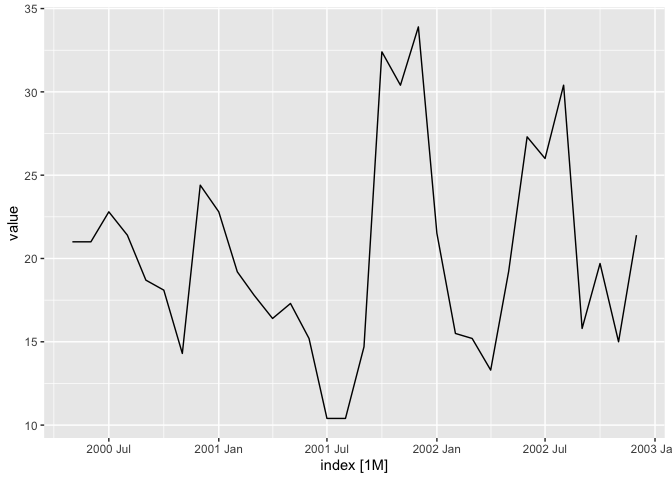
Below is the time series dataset after I have converted it using the as.ts function. The date variable is all muddle up!

Date Maize Exports (m/t) Rainfall (mm) Temperature © Exchange rate (R/$) Maize price (R) FDI (Million R) GDP (Million R) Oil prices (R/barrel)
[1,] 957139200               21000          30.8         14.36           0.1435235          677.88            4337            9056                192.35
[2,] 959817600               54000          14.9         13.96           0.1474926          583.48           -4229            9056                205.36
[3,] 962409600              134000          11.1         12.61           0.1437298          518.10           -4229            8841                196.38
[4,] 965088000              213000           6.1         15.27           0.1433075          525.59           -4229            8841                204.66
[5,] 967766400              123000          38.5         17.83           0.1382170          576.08            6315            8841                233.64
[6,] 970358400               94000          61.9         20.10           0.1322751          635.79            6315            4487                231.27
     

There's a trick, and it's entirely unobvious. For the common time series, annual, monthly and quarterly, you don't need a date column at all, just a note of the value of the first year and month. For daily, weekly and other frequencies that don't have integer frequencies (like week, which averages 52.18 days per year), it's trickier.

Let's suppose that I have a fleet of vehicles that I drive on an irregular rotation and want to know how my mileage varies over time. I'm going to recruit mtcars$mpg and convert it to a time series. mtcars doesn't have a date column.

series <- ts(mtcars$mpg, frequency = 12, start = c(2000, 5))
plot(series)

Created on 2023-01-25 with reprex v2.0.2

Thank you so much for your speedy response @technocrat. I understand what you're saying, however, my data requires a monthly date in it and after having employed your method, I still get the same issue. All I need is for my data to be in TS format and for the date to be in the same format as the first example I posted. I just need my date to make sense, that's it really.

Data structure and data presentation are separate. Try this

library(fpp3)
#> ── Attaching packages ──────────────────────────────────────────── fpp3 0.4.0 ──
#> ✔ tibble      3.1.8      ✔ tsibble     1.1.3 
#> ✔ dplyr       1.0.10     ✔ tsibbledata 0.4.1 
#> ✔ tidyr       1.3.0      ✔ feasts      0.3.0 
#> ✔ lubridate   1.9.1      ✔ fable       0.3.2 
#> ✔ ggplot2     3.4.0
#> ── Conflicts ───────────────────────────────────────────────── fpp3_conflicts ──
#> ✖ lubridate::date()    masks base::date()
#> ✖ dplyr::filter()      masks stats::filter()
#> ✖ tsibble::intersect() masks base::intersect()
#> ✖ tsibble::interval()  masks lubridate::interval()
#> ✖ dplyr::lag()         masks stats::lag()
#> ✖ tsibble::setdiff()   masks base::setdiff()
#> ✖ tsibble::union()     masks base::union()
series <- ts(mtcars$mpg, frequency = 12, start = c(2000, 5))
series <- as_tsibble(series)
autoplot(series)
#> Plot variable not specified, automatically selected `.vars = value`

Created on 2023-01-27 with reprex v2.0.2

If you need help using your data, you can use a a reprex. See the FAQ. That will make it easier to attract answers because all that is required to bring in the data will be a cut-and-paste.

Practice tip: save long descriptive variable names for table column labels in presentation. For analysis use shorter names, such as

colnames(my_data) <- c("dated","maize_exp","rain","temp","exch_rate","maize_price","fdi","gdp","oil","inflation")

At print time, use packages like {gt} or save a copy of the source names and then restore

header <- colnames(my_data)
colnames(my_data) <- c("dated","maize_exp","rain","temp","exch_rate","maize_price","fdi","gdp","oil","inflation")
# do some analysis
# restore original
colnames( my_data) <- header
1 Like

Hi. After

library(fpp3)
series <- ts(mtcars$mpg, frequency = 12, start = c(2000, 5))
series <- as_tibble(series)
autoplot(series)

I get

Error: Objects of type tbl_df/tbl/data.frame not supported by autoplot.

You used as_tibble() instead of as_tsibble()

1 Like

Whoops - you're right. Thank you.

This topic was automatically closed 42 days after the last reply. New replies are no longer allowed.

If you have a query related to it or one of the replies, start a new topic and refer back with a link.