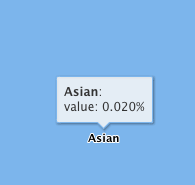
I've made a treemap in high charter and I want to print the value multiplied by 100 and add a percentage symbol on the end. I currently have this code that produces the image below
hchart(dout, type = "treemap")%>%
  hc_tooltip(pointFormat = "<b>{point.name}</b>:<br>
                             value: {point.value:.3f}%<br>")

Based on my reading of the high charter documentation, I need to do something like this using a JS script function (but this exact code doesn't produce what I want) :
hchart(dout, type = "treemap")%>%
  hc_tooltip(pointFormat = "<b>{point.name}</b>:<br>",
             formatter = JS("function(){ return point.value * 100 + '%'; }"))
I'm fairly new to R and definitely don't have any experience with JS
I've read this https://api.highcharts.com/highcharts/tooltip.formatter
and I've searched for examples of how formatter is used but I still don't understand.