Hello,
I cleaned my data set and want to do monthly forecasting.
As shown, I have the year and the month and the corresponding total volume for this year.month
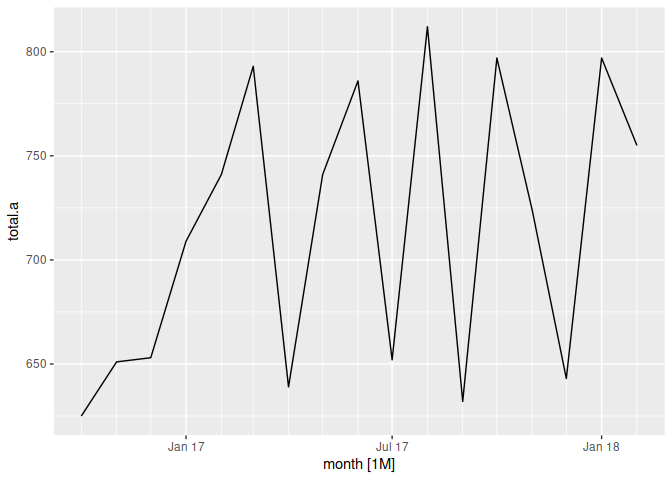
I converted my data to time series using ts, but I want to use ggplot2 to show the total.a of each month and year on a time series plot. I used autoplot before, but autoplot shows the labels as integers. This is not good enough. I appreciate your help.
# Libraries
library(tidyverse)
library(ggplot2)
library(forecast)
# Data
year.month.r <- c('2016-10', '2016-11','2016-12','2017-01','2017-02',
                  '2017-03','2017-04','2017-05','2017-06','2017-07',
                  '2017-08','2017-09','2017-10','2017-11','2017-12',
                  '2018-01','2018-02')

total.a <- c(625,651,653,709, 741,
              793,639,741,786,652,
             812,632,797,724,643,
             797,755)

df.r <- data.frame(year.month.r, total.a)

df.r
# Convert df to time series object starting with 2016-10 and ending in 2017-02 ####
# I am starting at '2016-10' and ending at '2018-02' and the data is monthy, so frequency = 12.

df.ts.r <- ts(df, start = as.Date('2016-10'), end = as.Date('2018-02'), frequency = 12)  # Frequency is 12 so data is monthly
df.ts.r
# Use ggplot to draw time series with monthly labels ##
sc <- scale_x_date(
  limits = as.Date(c('2016-10','2018-02')),
  date_labels = '%b %y',
  date_minor_breaks = '1 month')
I get an this error:
Error in charToDate(x) :
character string is not in a standard unambiguous format
