I must be missing something obvious here.
How can I convert a tibble into a character vector so that I can use it in scales_fill_manual(values=...)
(I disregard the option to simply merge both tibbles here).
library(tidyverse)
this is what I have
df_my_colors<- tibble::tribble(
  ~unit,  ~color,
      "Ideal",  "blue",
      "Premium",   "red",
      "Good", "green"
  )
this is what I want
c("Ideal"="blue", "Premium"="red", "Good"="green")
#>   Ideal Premium    Good
#>  "blue"   "red" "green"
this is what I tried (among others)
my_colors <- df_my_colors %>%
  pivot_wider(id_cols="unit", names_from="unit", values_from="color")
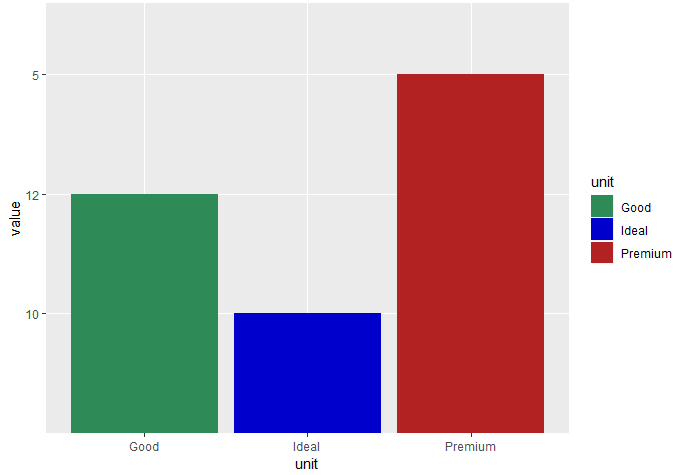
that's how I want to use it.
diamonds %>%
  filter(cut %in%df_my_colors$unit) %>%
  ggplot()+
  geom_bar(aes(x=cut,
               fill=cut),
           stat="count")+
 #scale_fill_manual(values=c("Ideal"="blue", "Premium"="red", "Good"="green"))
 scale_fill_manual(values=my_colors)