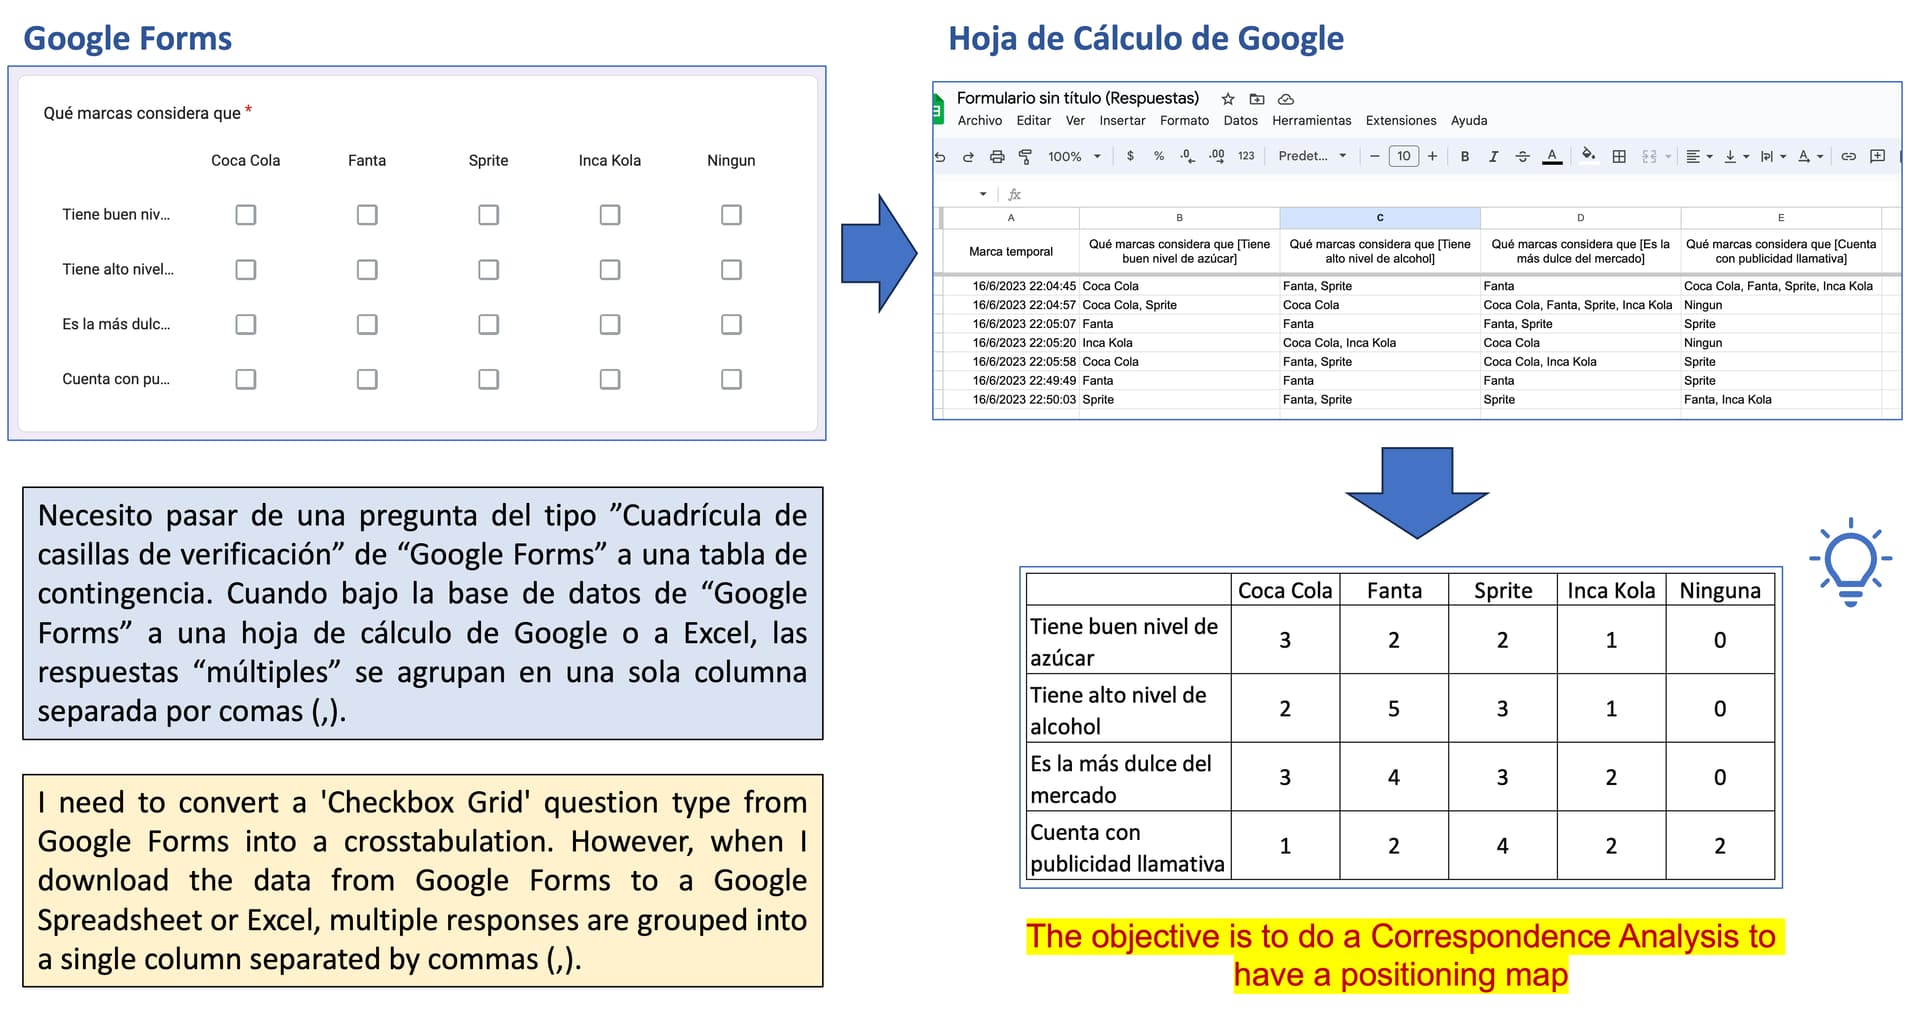
I need to convert a 'Checkbox Grid' question type from Google Forms into a crosstabulation. However, when I download the data from Google Forms to a Google Spreadsheet or Excel, multiple responses are grouped into a single column separated by commas (,).
Below is one way to achieve the desired outcome, which uses pivot_longer() / pivot_wider() to reshape the data and separate_rows() to create a new row for each entry separated by a comma.
library(tidyverse)

# sample data
df = data.frame(
  q1 = c('Coca Cola', 'Coca Cola, Sprite', 'Fanta', 'Inca Kola', 'Coca Cola', 'Fanta', 'Sprite'),
  q2 = c('Fanta, Sprite', 'Coca Cola', 'Fanta', 'Coca Cola, Inca Kola', 'Fanta, Sprite', 'Fanta', 'Fanta, Sprite'),
  q3 = c('Fanta', 'Coca Cola, Fanta, Sprite, Inca Kola', 'Fanta, Sprite', 'Coca Cola', 'Coca Cola, Inca Kola', 'Fanta', 'Sprite'),
  q4 = c('Coca Cola, Fanta, Sprite, Inca Kola', 'Ningun', 'Sprite', 'Ningun', 'Sprite', 'Sprite', 'Fanta, Inca Kola')
)

out = df |>
  mutate(row = row_number()) |>
  pivot_longer(-'row') |>
  separate_rows(value, sep = ', ') |>
  count(name, value) |>
  pivot_wider(names_from = value, values_from = n) |>
  select(`Coca Cola`, Fanta, Sprite, `Inca Kola`, `Ningun`) |>
  mutate_all(~replace_na(., 0))

out
#> # A tibble: 4 × 5
#>   `Coca Cola` Fanta Sprite `Inca Kola` Ningun
#>         <int> <int>  <int>       <int>  <int>
#> 1           3     2      2           1      0
#> 2           2     5      3           1      0
#> 3           3     4      3           2      0
#> 4           1     2      4           2      2
Created on 2023-06-19 with reprex v2.0.2
1 Like
Thank you very much for your help, I was able to perform my analysis
This topic was automatically closed 7 days after the last reply. New replies are no longer allowed.
If you have a query related to it or one of the replies, start a new topic and refer back with a link.