The labels argument of scale_y_continuous can be a function that takes breaks as input and returns labels as output. To specify a different function for each facet in a plot, you can use a global variable to keep track of the plot index.
library(tidyverse)
library(palmerpenguins)
dummy_data <- penguins %>% pivot_longer(cols = where(~ !is.factor(.x)), names_to = "Estimate", values_to = "Value")
plot_index <- 0 # Based on: https://coolbutuseless.github.io/2019/03/07/custom-axis-breaks-on-facetted-ggplot/
label_fun <- function(x) {
plot_index <<- plot_index + 1L
switch(plot_index,
scales::label_number(accuracy = 1, suffix = "X", big.mark = "")(x),
scales::label_percent(scale = 1)(x),
scales::label_percent(scale = 0.01)(x),
scales::label_number_auto()(x),
scales::label_number(accuracy = 1, big.mark = "")(x))
}
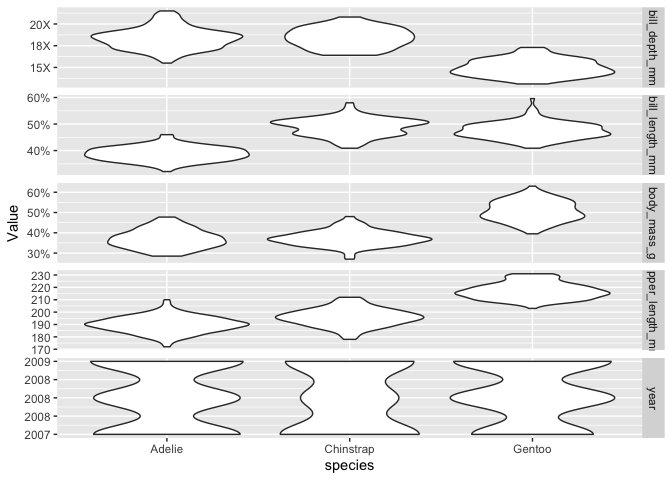
ggplot() +
geom_violin(data = dummy_data, aes(x = species, y = Value)) +
facet_grid(Estimate ~ . , scales = "free") +
scale_y_continuous(labels = label_fun)
#> Warning: Removed 8 rows containing non-finite values (stat_ydensity).
Created on 2021-11-12 by the reprex package (v2.0.1.9000)