How do I control the fill color order in geom_bar? For example, considering the following plot:
library(ggplot2)

df2 <- data.frame(
  x = c("A", "B", "C", "A", "B", "C"),
  fill_col = c(TRUE, TRUE, TRUE, FALSE, FALSE, FALSE),
  vals = c(100, 115, 120, 10, 15, 20)
)

ggplot(df2, aes(x, vals, fill = fill_col)) +
  geom_bar(stat = "identity") +
  coord_flip()
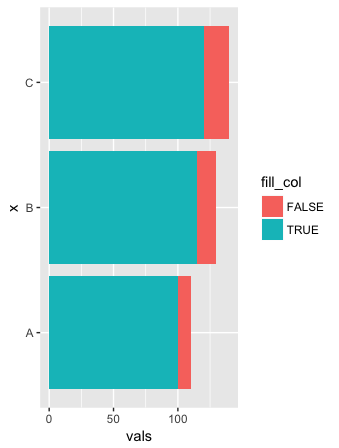
If I wanted the pink FALSE values to appear on the bottom (or left) of the plot, what changes to the ggplot call could I make?
ggplot(df2, aes(x, vals, fill = fill_col)) +
  geom_bar(stat = "identity", position = position_stack(reverse = TRUE)) +
  coord_flip()
I couldn't recall offhand, but found it here:
3 Likes
Also, this is a great post by Joyce Robbins @jtr13 on reordering using the forcats package: https://github.com/jtr13/codehelp/blob/master/R/reorder.md
Oops, wrong kind of ordering — I should have read more carefully! Still a great post though 
3 Likes
coord_flip() solves this specific question, but I would suggest being aware of the power of forecats as a neat way to control the placement or ordering of categorical variables in a ggplot.
Here's a nice blogpost on the topic "Be the boss of your factors" (by Jenny Bryan), which includes a number of sections connecting this to ggplots.
1 Like