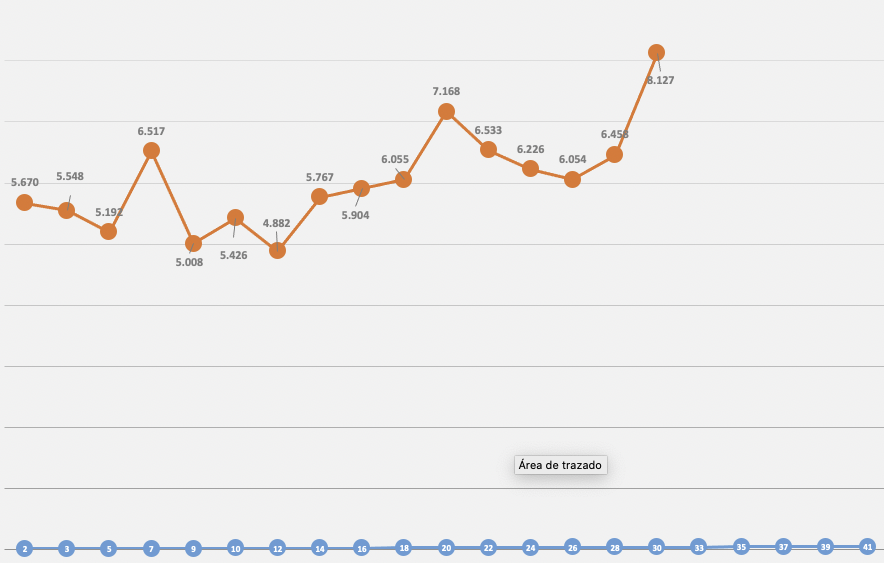
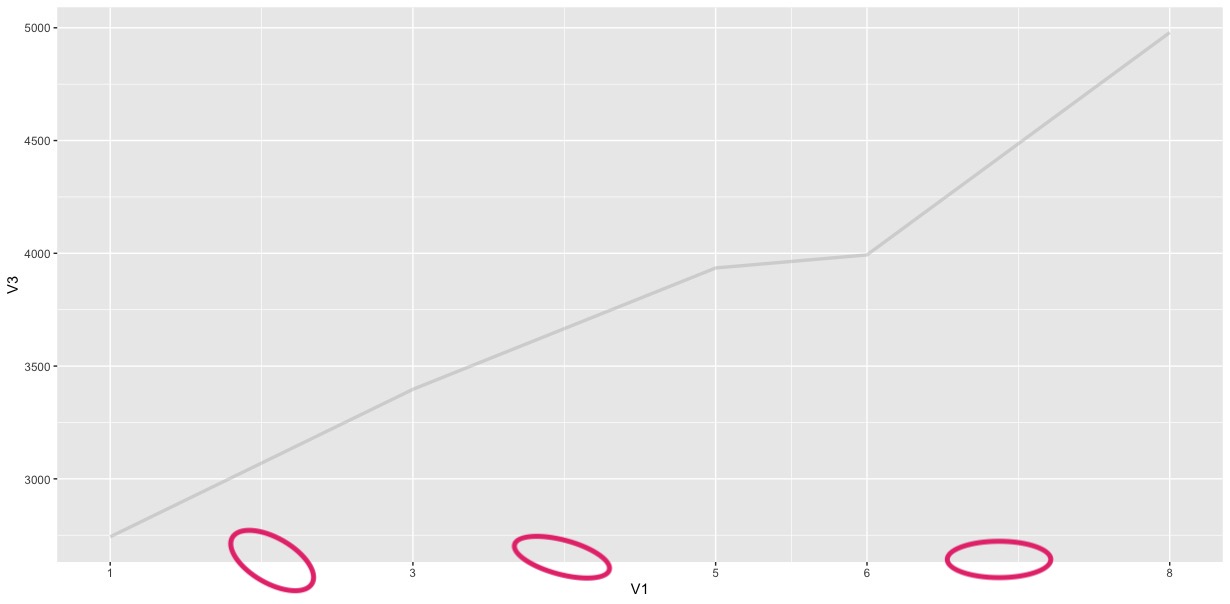
I'm trying to get the x-axis to show me only and exclusively 1, 3, 5, 6, 8, on a continuous basis, without showing intermediate steps. Something like this:
Thanks nirgrahamuk, but with this solution I still have a blank space between 1 and 3, 3 and 5, 6 and 8, they don't follow the whole line as in the example or like between 5 and 6...maybe it can't be achieved with ggplot?
I'm afraid it's not clear what you want. The breaks you requested are arbitrary. Do you want the line chart distorted so that each break is equidistant to the other ? Seems an odd request but doable.... Or do you intend something else ?
ggplot(data = public) +
  aes(x = factor(V1), y = V3, group = 1) +
  geom_line(color="grey", size=1.2, alpha=0.5)