Hi R Studio Community,
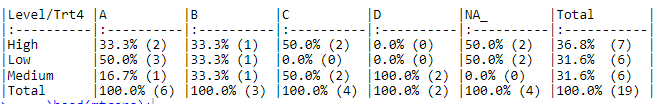
I would like to provide a contingency table {freq (percent)}. I have this code which provide percent (freq), If somebody can help with with fixing the code that provide freq (percent) or provide me a different code that provide the expected result. It is appreciated. Thanks
# data
data <- data.frame(Id = c(1L,	1L,	1L,	1L,	1L,	2L,	2L,	2L,	2L,	3L,	3L,	3L,	3L,	3L,	4L,	4L,	4L,	4L,	4L),
                   date1 = c("2020-01-20",	"2020-02-20",	"2020-03-20",	"2020-04-20",	"2020-05-10",	"2020-01-20",	"2020-02-15",	"2020-03-20",	"2020-04-15",	"2020-05-10",	"2020-07-15",	"2020-08-15",	"2020-10-25",	"2020-11-10",	"2020-04-10",	"2020-04-10",	"2020-08-15",	"2020-10-25",	"2020-10-27"),
                   date2 = c("2020-01-20",	"2020-03-25",	"2020-03-20",	"2020-05-15",	"2020-06-12",	"2020-02-20",	"2020-03-20",	"2020-04-22",	"2020-05-15",	"2020-06-12",	"2020-08-20",	"2020-09-22",	"2020-11-15",	"2021-01-12",	"2020-05-12",	"2020-08-20",	"2020-09-22",	"2020-11-15",	"2020-10-29"),
                   date3 = c("2020-02-20",	"2020-04-25",	"2020-03-29",	"2020-06-15",	"2020-06-22",	"2020-03-20",	"2020-04-20",	"2020-05-22",	"2020-06-15",	"2020-06-22",	"2020-08-30",	"2020-09-27",	"2020-11-19",	"2021-01-28",	"2020-05-27",	"2020-08-26",	"2020-09-28",	"2020-11-18",	"2020-111-27"),
                   date4 = c("2020-03-20",	"2020-05-25",	"2020-03-30",	"2020-07-15",	"2020-06-29",	"2020-03-25",	"2020-04-27",	"2020-05-28",	"2020-06-19",	"2020-06-28",	"2020-09-30",	"2020-10-27",	"2020-11-29",	"2021-01-28",	"2020-06-27",	"2020-09-26",	"2020-09-28",	"2020-12-18",	"2020-111-28"),
                   Trt1 = factor(c("A",	"B",	"C",	"A",	"D",	NA,	"B",	"C",	"D",	"A",	"B",	NA,	"C",	"D",	"D",	"B",	"C",	"C",	"D")),
                   Trt2 = factor(c("A",	"D",	"A",	NA,	"D",	NA,	"A",	NA,	"A",	"B",	"B",	NA,	"A",	"A",	"A",	"C",	"A",	"A",	"B")),
                   Trt3 = factor(c("A",	"C",	"B",	"B",	"D",	NA,	"C",	"A",	"B",	"D",	"B",	NA,	"C",	"B",	"D",	"B",	"B",	"C",	"D")),
                   Trt4 = factor(c("C",	"A",	"B",	"A",	"D",	NA,	NA,	"C",	"A",	NA,	"B",	NA,	"A",	"D",	"A",	"C",	"C",	"A",	"B")),
                   Level = factor(c("High",	"Medium",	"Low",	"High",	"Medium",	"Low",	"High",	"Medium",	"Low",	"High",	"Medium",	"Low",	"High",	"Medium",	"Low",	"High",	"Medium",	"Low",	"High")),
                   stringsAsFactors = FALSE)

# contingency table

library("janitor")
data %>%
  tabyl(Level,Trt4,show_missing_levels = FALSE)%>%
  adorn_totals(c("row", "col")) %>%
  adorn_percentages("col") %>%
  adorn_pct_formatting(rounding = "half up", digits = 1) %>%
  adorn_ns() %>%
  adorn_title("combined") %>%
  knitr::kable()