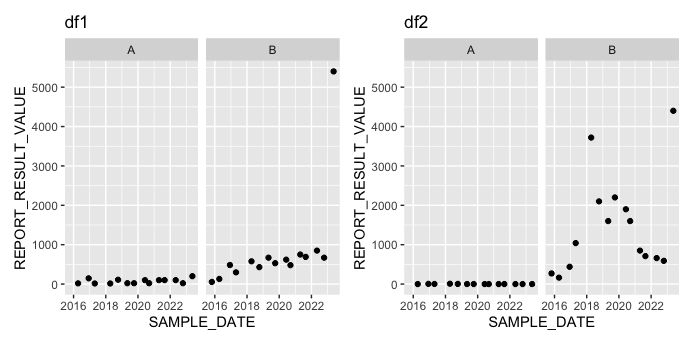
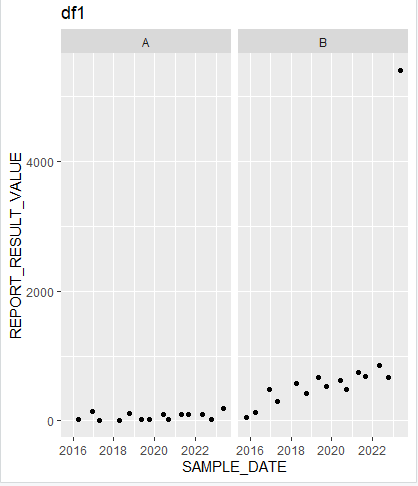
Is there a way to ensure consistent breaks for facets in ggplot2? This needs to be generalised though, I shouldn't be specifying the specific breaks each time.
Here the values go from 0 to 4000, but the breaks are different. The first one has breaks every 2000, while the second has breaks every 1000. In each case the maximum value exceeds the highest break value.
# data --------------------------------
df1 <- data.frame(
  stringsAsFactors = FALSE,
  SYS_LOC_CODE = c("A",
                   "A","A","A","A",
                   "A","A","A","A",
                   "A","A","A","A",
                   "A","B","B","B",
                   "B","B","B",
                   "B","B","B","B",
                   "B","B","B","B",
                   "B"),
  SAMPLE_DATE = as.Date(c("2016-04-12","2016-12-09","2017-04-26",
                  "2018-04-12","2018-10-07",
                  "2019-05-05","2019-10-04",
                  "2020-06-08","2020-09-10",
                  "2021-04-22","2021-08-28",
                  "2022-05-06","2022-10-16","2023-05-19",
                  "2015-10-26","2016-04-12",
                  "2016-12-09","2017-04-26",
                  "2018-04-12","2018-10-07",
                  "2019-05-03","2019-10-02","2020-06-08",
                  "2020-09-12","2021-04-23",
                  "2021-08-24","2022-05-07",
                  "2022-10-16","2023-05-19")),
  REPORT_RESULT_VALUE = c(18.5,146,
                          15,15,110,22,22,100,22,
                          100,100,100,22,200,54.6,
                          130,484,298,578,430,670,
                          530,620,480,750,690,850,670,
                          5400)
)

df2 <- data.frame(
  stringsAsFactors = FALSE,
  NA,
  SYS_LOC_CODE = c("A","A",
                   "A","A",
                   "A","A","A",
                   "A","A",
                   "A","A","A",
                   "A","A",
                   "B","B","B",
                   "B","B",
                   "B","B","B",
                   "B","B",
                   "B","B","B",
                   "B","B"),
  SAMPLE_DATE = as.Date(c("2016-04-12",
                  "2016-12-09",
                  "2017-04-26","2018-04-12",
                  "2018-10-07",
                  "2019-05-05",
                  "2019-10-04","2020-06-08",
                  "2020-09-10",
                  "2021-04-22","2021-08-28",
                  "2022-05-06",
                  "2022-10-16","2023-05-19",
                  "2015-10-26",
                  "2016-04-12",
                  "2016-12-09","2017-04-26",
                  "2018-04-12",
                  "2018-10-07","2019-05-03",
                  "2019-10-02",
                  "2020-06-08","2020-09-12",
                  "2021-04-23",
                  "2021-08-24",
                  "2022-05-07","2022-10-16",
                  "2023-05-19")),
  REPORT_RESULT_VALUE = c(0.42,5.59,
                          2.76,8.7,4,0.93,1,
                          0.33,0.31,0.31,
                          0.71,0.49,0.31,0.61,
                          270,163,439,
                          1040,3720,2100,1600,
                          2200,1900,1600,
                          850,710,660,590,
                          4400)
)

# graphs
ggplot(df1, aes(SAMPLE_DATE, REPORT_RESULT_VALUE)) +
  geom_point() +
  facet_wrap(~SYS_LOC_CODE) +
  labs(title = "df1")

ggplot(df2, aes(SAMPLE_DATE, REPORT_RESULT_VALUE)) +
  geom_point() +
  facet_wrap(~SYS_LOC_CODE) +
  labs(title = "df2")

Any ideas?