Hey everyone, can someone please explain what the confidence interval here is showing me? That we are some percent sure heights fall between less than 100 and more than 200? (whatever the exact starting and ending x values are) Maybe I'm just confused because R doesn't tell me what the population parameter is: a mean value, etc. Thank you
Could you show the ggplot code you used to generate this plot? That might help to get an answer.
You might find it helpful to play with method= in geom_smooth. Try method="lm" first and see if it makes sense, then elaborate if you feel the need to do so. It's easy to generate under-smooth results though.
Stephen
Without seeing your code, it's tough to know. Are you using geom_smooth() in the ggplot2 package to get the bands? According to the documentation (Smoothed conditional means — geom_smooth • ggplot2), this gives the confidence interval of the prediction.
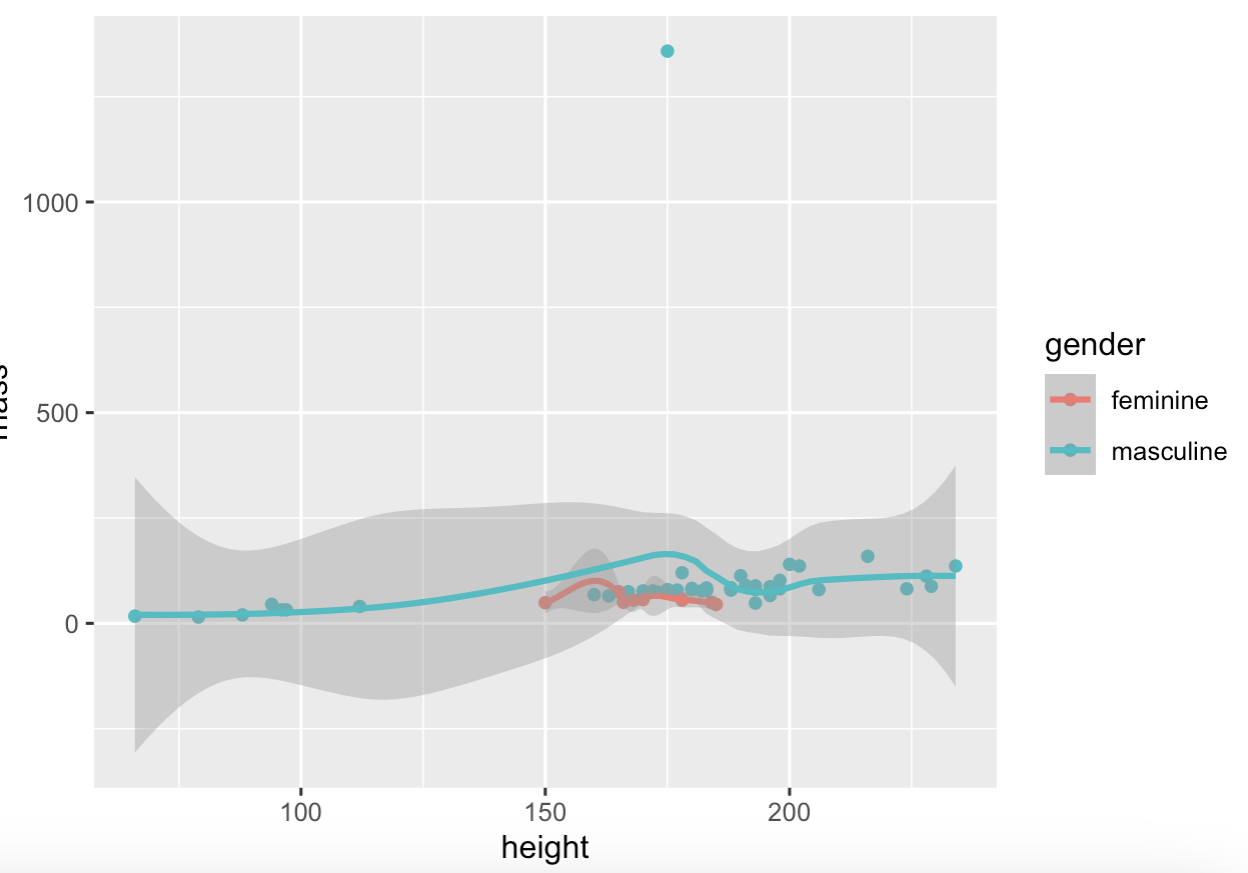
This is the code I used to generate the graph above:
starwars %>%
drop_na(gender, height, mass) %>%
ggplot(aes(height, mass, color = gender)) +
geom_point()+
geom_smooth()
Yes, below is the code I wrote to generate the graph above:
starwars %>%
drop_na(gender, height, mass) %>%
ggplot(aes(height, mass, color = gender)) +
geom_point()+
geom_smooth()
Thanks for the code you used. The shaded area around each curve is the "confidence interval around smooth" (from the help). The level is specified by the "level=" parameter; "level=0.95" is the default, for 95% confidence intervals. In this case, it is a frequentist probability that the points lie within the shaded region.
However, the loess curve (the default in this case) is almost certainly over-fitting. A linear function would be more rational I think, something like:
starwars %>%
  drop_na(gender, height, mass) %>%
  ggplot(aes(height, mass, color = gender)) +
  geom_point()+
  geom_smooth(method="lm")
However, presumably the mass can't be negative (!), so a different approach is probably advisable. Although this can be done in geom_smooth(), it is a bit of a pain to do (and I always have to look it up). It's probably easier to fit the model and build predictions outside the call to ggplot().
Stephen
1 Like
This topic was automatically closed 42 days after the last reply. New replies are no longer allowed.
If you have a query related to it or one of the replies, start a new topic and refer back with a link.