I've tried googling this but can't find anything, so apologies if there's an obvious solution, but so far it's eluded me.
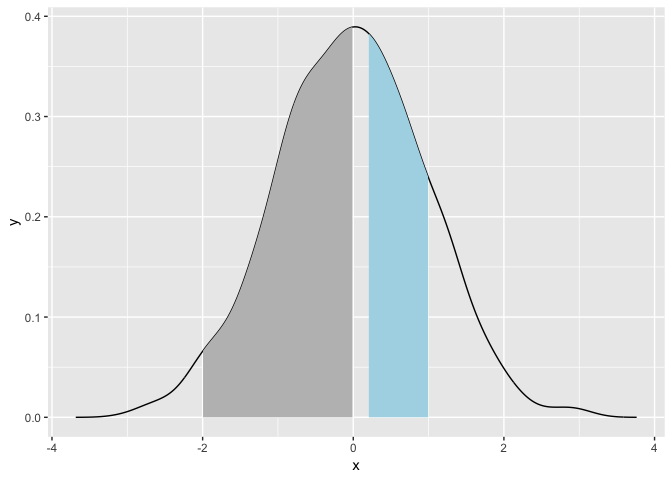
I ultimately want to create a geom_density_ridges plot using the ggridges package, and fill in the parts of the density plots where values are, for example, >= -2 & =< 0 with some colour, and the part of the plot where >=0.2 & <= 1 with another.
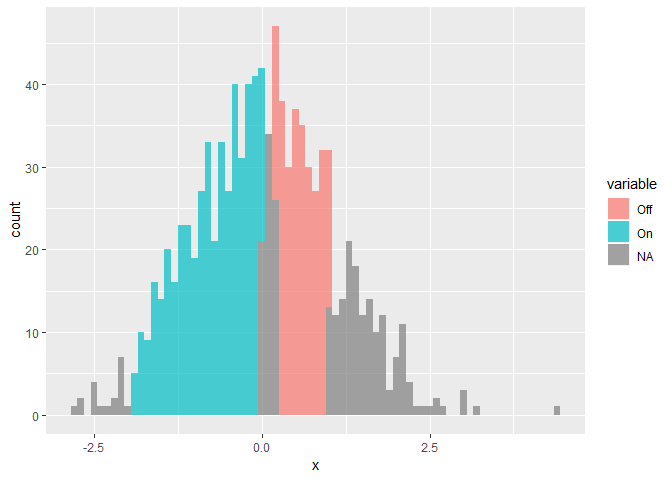
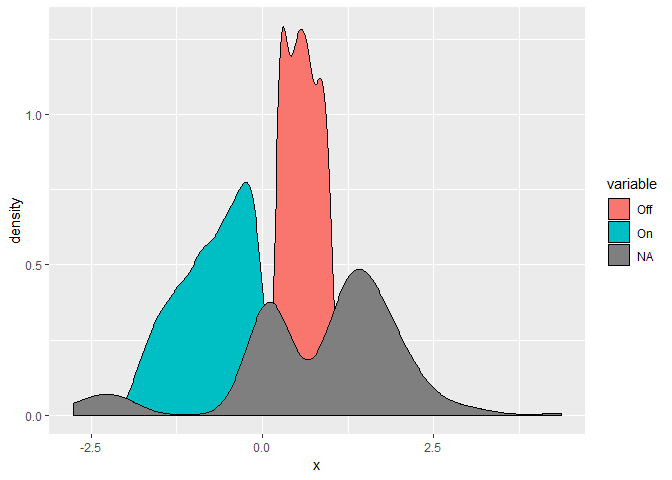
Below is the closest I've got whereby I create another variable which is conditional on the values of x. This sort of works for a histogram but obviously fails for geom_density() since ggplot treats each fill as a group. I basically just need to 'overlay' my arbitrary fills. Does that make sense?
library(tidyverse)

data <-
  tibble(
    x = rnorm(1000, mean = 0, sd = 1)
  ) %>%
  mutate(
    variable = case_when(
      (x >= -2 & x <= 0) ~ "On",
      (x >= 0.2 & x <= 1) ~ "Off",
      TRUE ~ NA_character_
    )
  )


ggplot(data, aes(x, fill = variable)) +
  geom_histogram(binwidth = 0.1, alpha = 0.7)
ggplot(data, aes(x, fill = variable)) +
  geom_density()
Created on 2018-11-12 by the reprex package (v0.2.1)