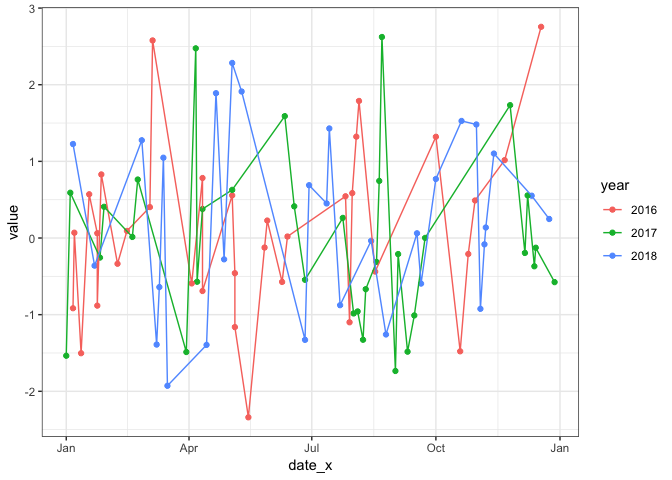
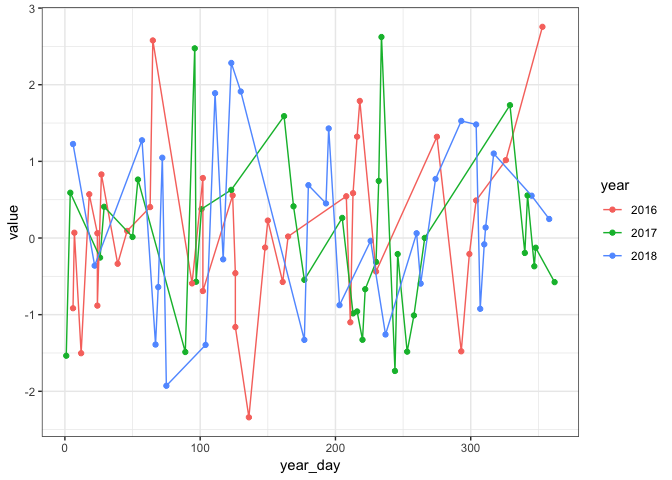
I'm interested in comparing values from specific dates across different years, the following works, but it is a bit "hacky", so I'm curious if there is a more straight forward and elegant way?
Briefly: For each data, I extract the specific year and use that to colour by and then I create a "dummy" date, where I set all years to 2020 and then on the x-axis I only show month and day from the "dummy" date
# Load libraries
library('tidyverse')
library('lubridate')
library('scales')

# Create example data
set.seed(566684)
n = 100
d = tibble(day    = sample(1:31, n, replace = TRUE),
           month  = sample(1:12, n, replace = TRUE),
           year   = sample(2016:2018,n, replace = TRUE) %>% factor,
           date   = paste(day, month, year, sep = '-') %>% dmy,
           value  = rnorm(n),
           date_x = date %>% as.character %>%
                      str_replace("^\\d{4}","2020") %>% as_date)

# Create plot
d %>%
  ggplot(aes(x = date_x, y = value, colour = year)) +
  geom_point() +
  geom_line() +
  theme_bw() +
  scale_x_date(labels = date_format("%b"))

