Commute Explorer
https://nz-stefan.shinyapps.io/commute-explorer-2/
Authors: Stefan Schliebs
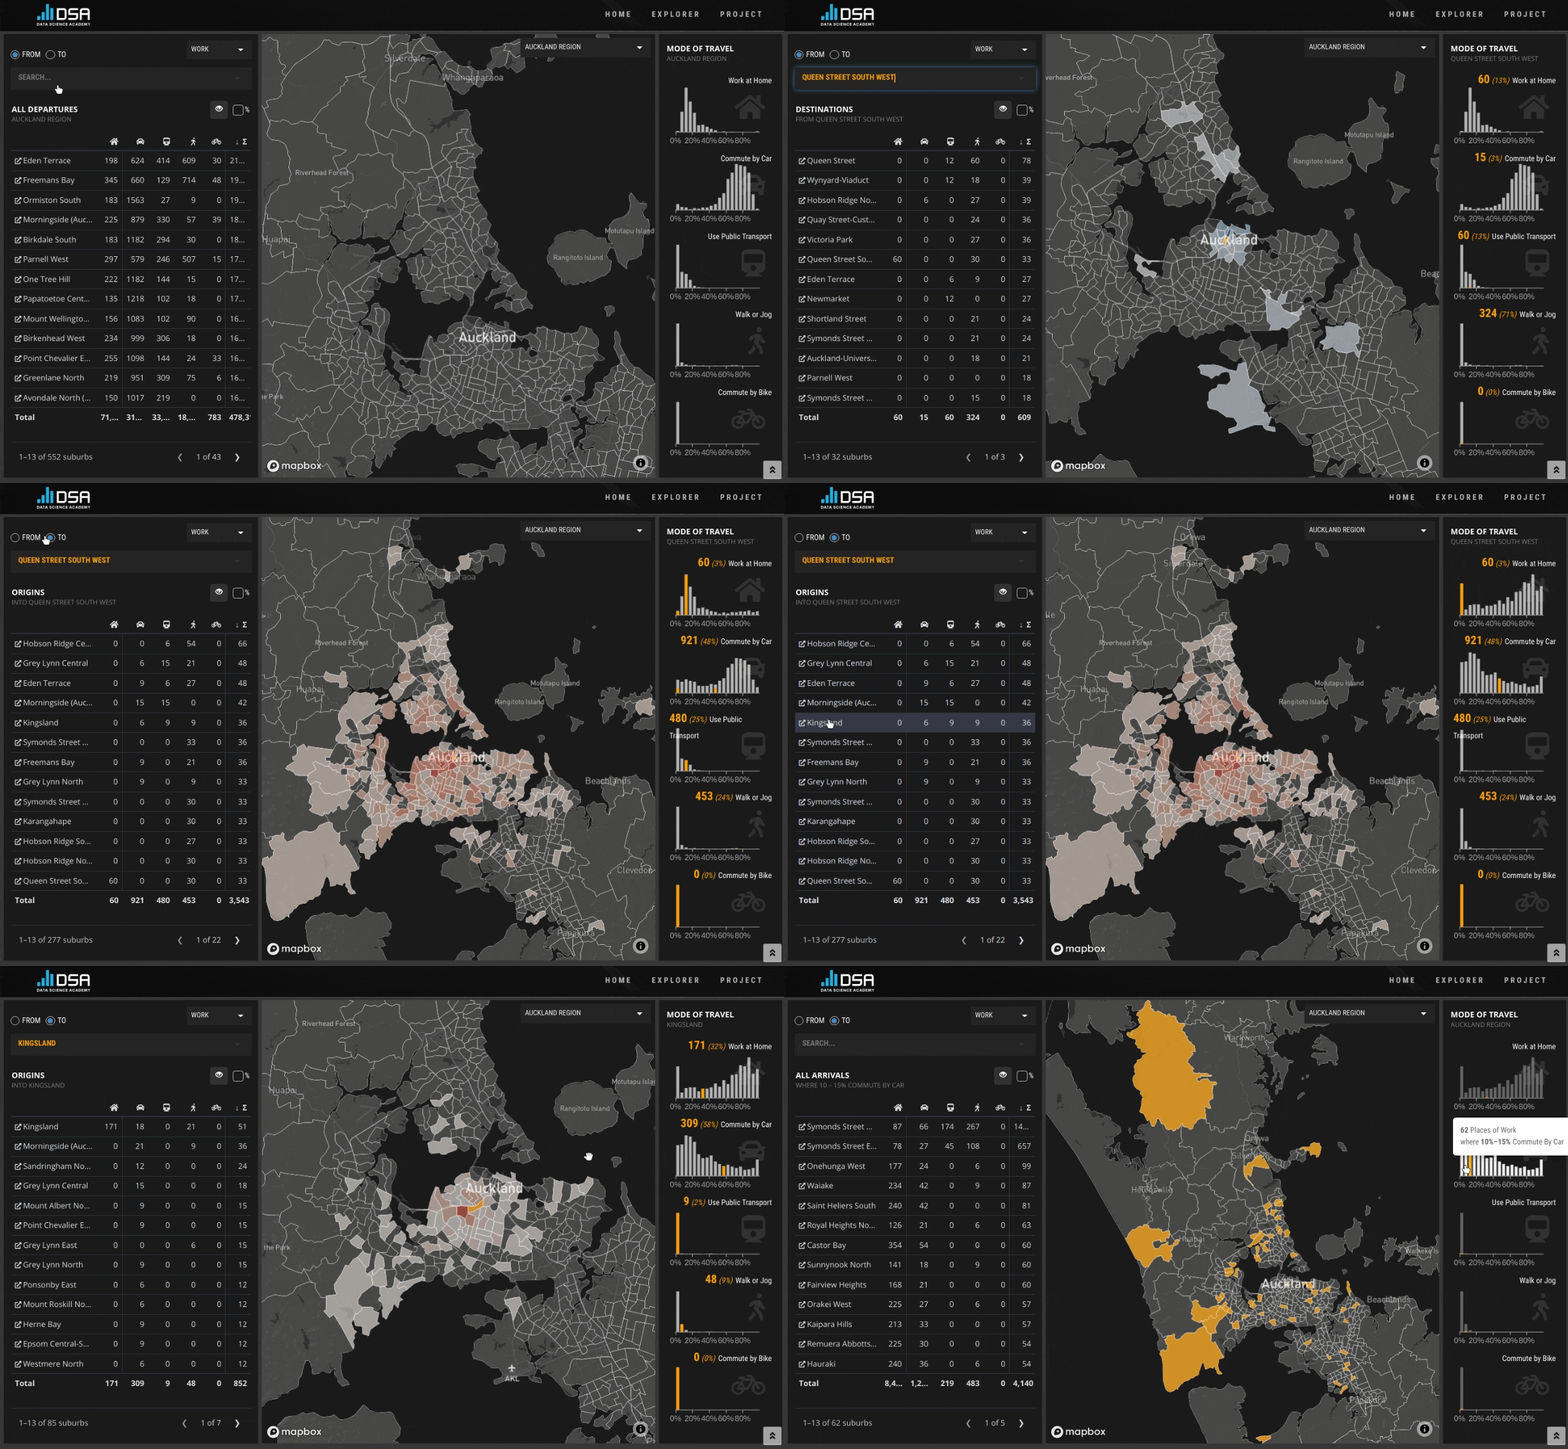
Abstract: This project explores the commuting behavior of New Zealanders based on the Stats NZ Census 2018 data set. The app uses a custom HTML template to present commuting figures on a map, mode of travel visualizations, work and education related commuting and various filtering options.
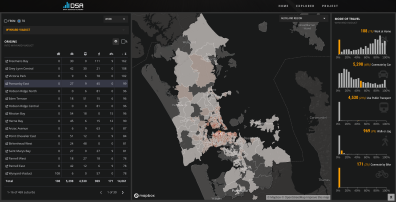
Full Description: In this project I explore the commuting behavior of New Zealanders based on the Stats NZ Census 2018 data set. I wanted to create a well-designed and intuitive map based web application that uses colors and visual cues consciously to capture the user's interest long enough to spent time playing and engaging with the data.
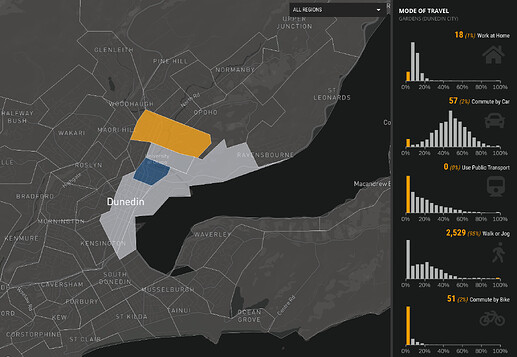
Plain numbers are often hard to comprehend and so I made some effort to make commuter figures more relatable. The mode of travel histograms give an impression of how fractions of commuters distribute across the various places of residence and work. Clicking on a bucket in the charts highlights the corresponding regions in the map. This feature allows to find "interesting" regions, e.g. suburbs where the majority of commuters walk to work or where many residents work at home. There are indeed regions where 95% or more commuters walk or jog to a place of education.
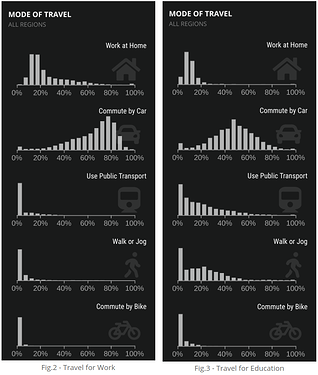
The histograms also highlight the difference in commuting behaviors between work and study commuters. Students tend to use cars much less frequently and instead travel on public transportation, walk or even bike to get around.
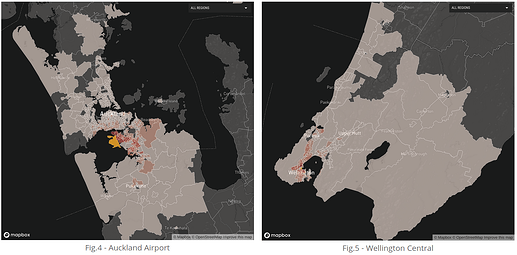
Major commuting destinations include universities, airports, CBDs of larger cities and commercial areas like malls and business parks.
Keywords: map, mapboxer, html templates, echarts4r, reactable
Shiny app: https://nz-stefan.shinyapps.io/commute-explorer-2/
Repo: GitHub - nz-stefan/commute-explorer-2: R Shiny Contest 2021 submission
RStudio Cloud: Posit Cloud
Thumbnail:
Full image:
