Hello,
I need to format the common axis title in grid.arrange.
Here is an example:
plots
p1 <- ggplot(data = mtcars, aes(x = mpg, y = cyl))
p2 <- ggplot(data = mtcars, aes(x = mpg, y = cyl))
p3 <- ggplot(data = mtcars, aes(x = mpg, y = cyl))
p4 <- ggplot(data = mtcars, aes(x = mpg, y = cyl))
General axis labels
yleft <- textGrob("name 1 (tha^-1)", rot = 90, gp = gpar(fontsize = 20))
yright <- textGrob("name 2 and 3 (t ha^-1)", rot = 270, gp = gpar(fontsize = 20))
bottom <- textGrob("age (years)", gp = gpar(fontsize = 20))
Join plots
uni <- grid.arrange(p1, p2, p3, p4, ncol = 2, nrow = 2, right = yright, left = yleft, bottom = bottom)
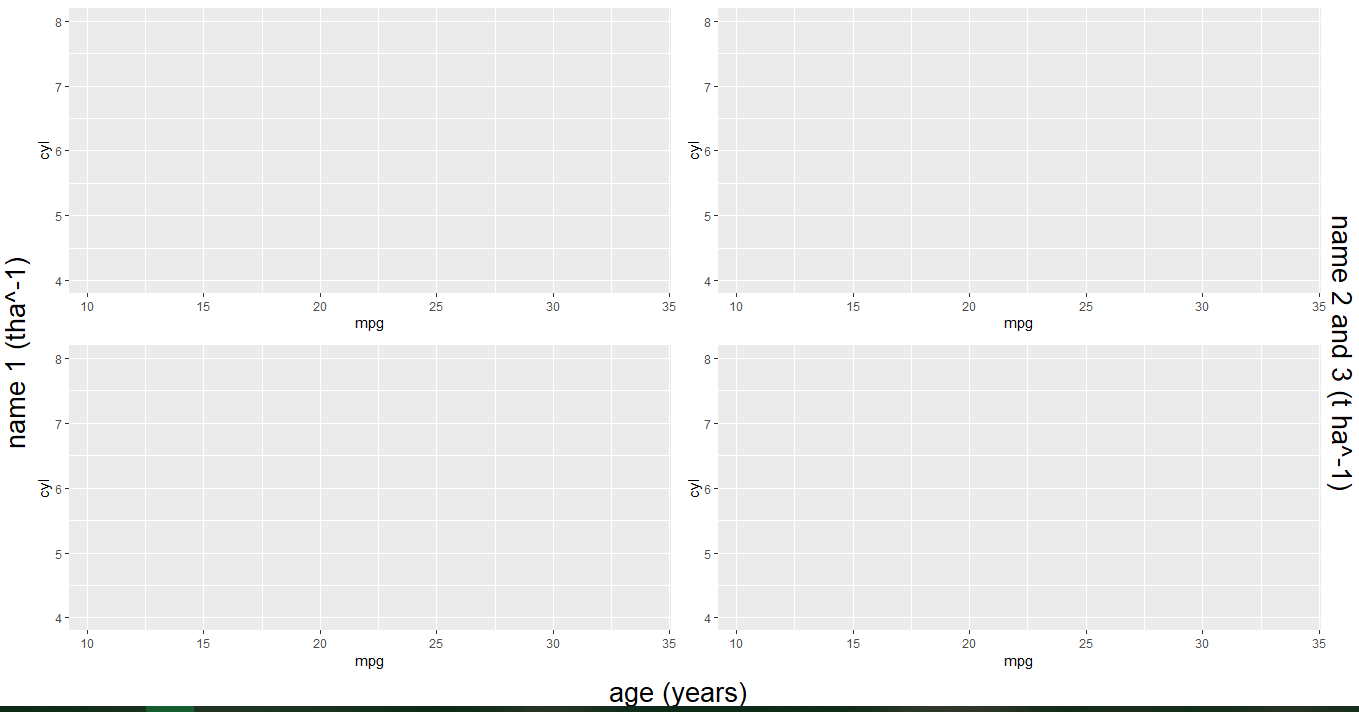
How can I format the superscripts characters and use different colors by word (like ggtext package does)?
I've tried several ways to do it and it still didn't work.
Can someone help?