X1 = c(2.5, 0.5, 2.2, 1.9, 3.1, 2.3, 2, 1, 1.5, 1.1)
X2 = c(2.4, 0.7, 2.9, 2.2, 3, 2.7, 1.6, 1.1, 1.6, 0.9)
var(X1)
[1] 0.6165556
var(X2)
[1] 0.7165556
cov(1,X2)
Error in cov(1, X2) : incompatible dimensions
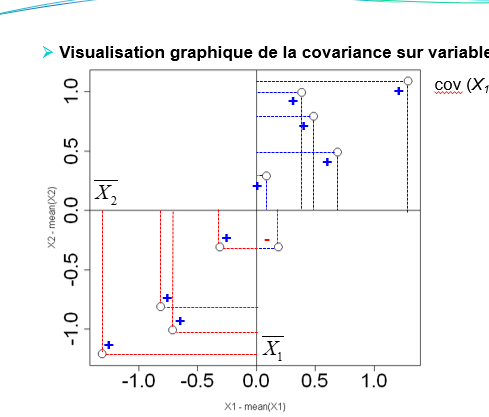
cov(X1,X2)
[1] 0.6154444
plot(cov(X1,X2))
X1 = c(2.5, 0.5, 2.2, 1.9, 3.1, 2.3, 2, 1, 1.5, 1.1)
X2 = c(2.4, 0.7, 2.9, 2.2, 3, 2.7, 1.6, 1.1, 1.6, 0.9)
var(X1)
[1] 0.6165556
var(X2)
[1] 0.7165556
cov(1,X2)
Error in cov(1, X2) : incompatible dimensions
cov(X1,X2)
[1] 0.6154444
plot(cov(X1,X2))
This topic was automatically closed 21 days after the last reply. New replies are no longer allowed.
If you have a query related to it or one of the replies, start a new topic and refer back with a link.