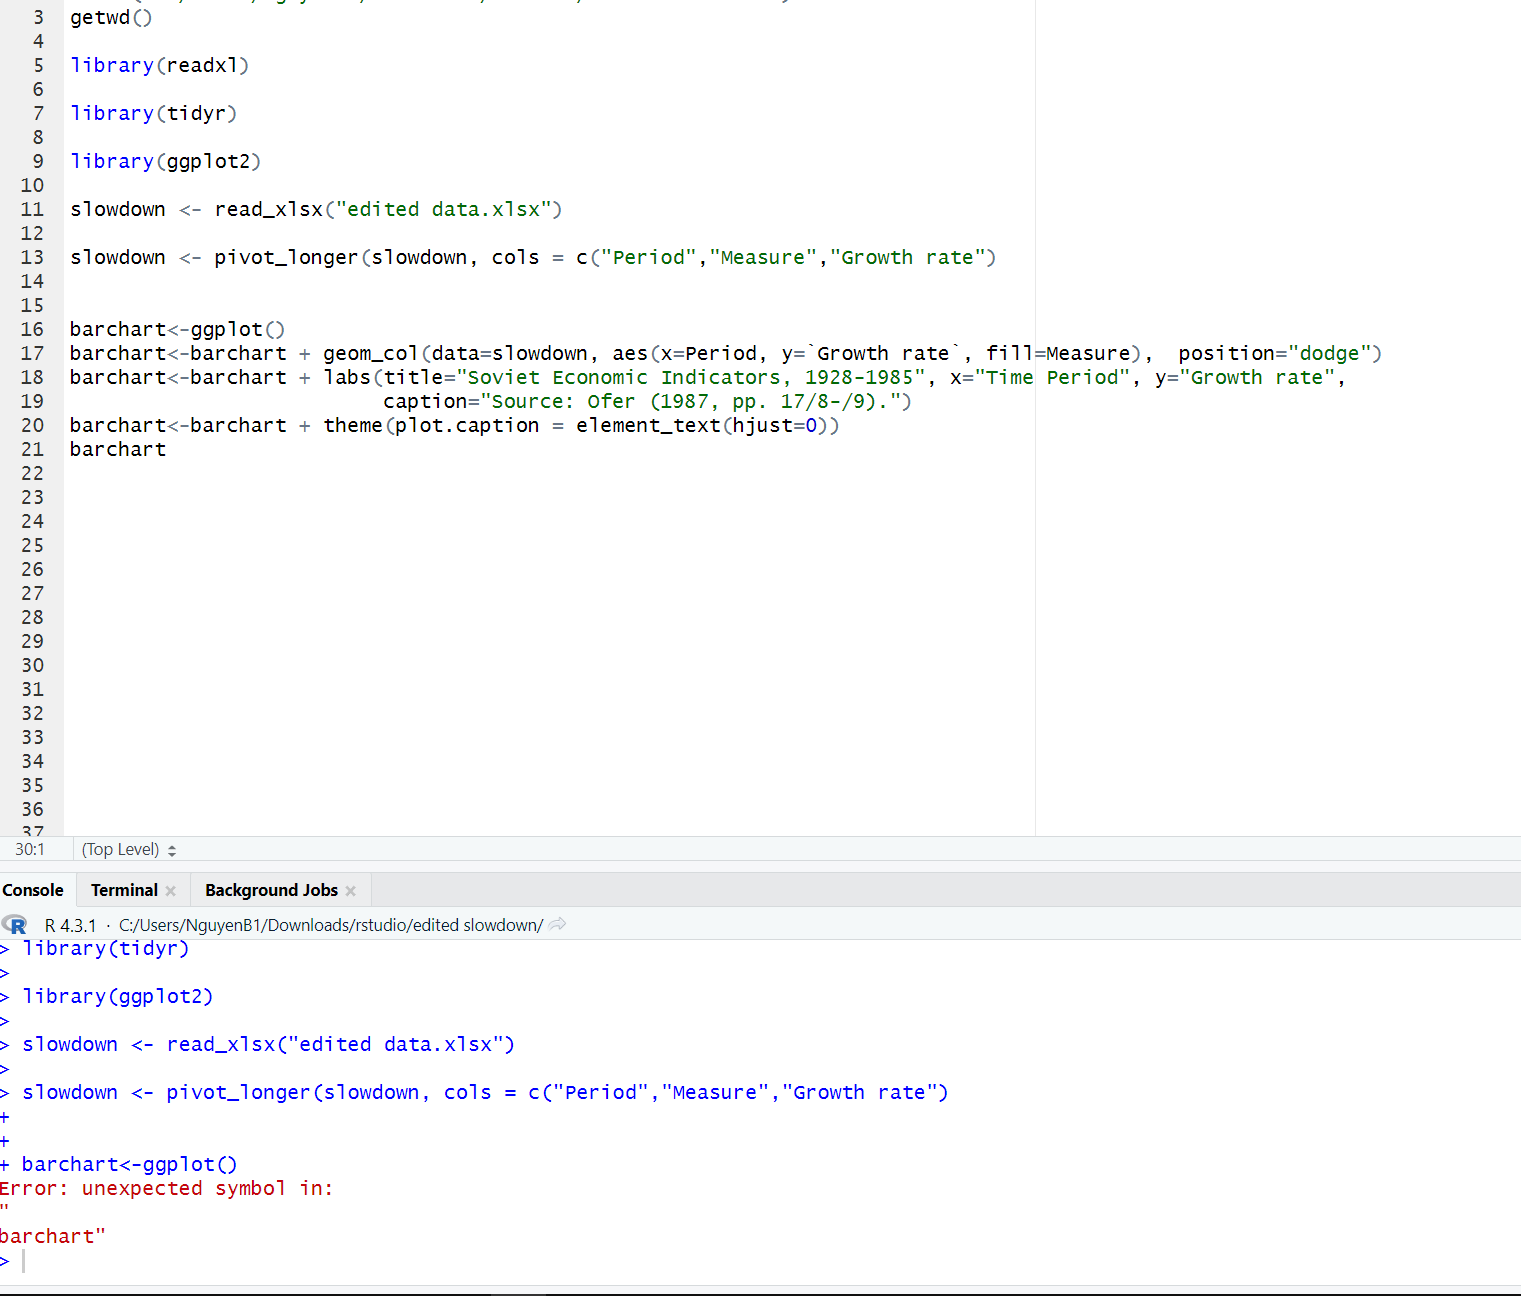
look at your y axis; your y quantity is the text "Growth Rate", to access a variable in the data.frame passed to ggplot() you normally just write it unqouted (like you did for period, where it has a space you cant do this, so instead you use backticks
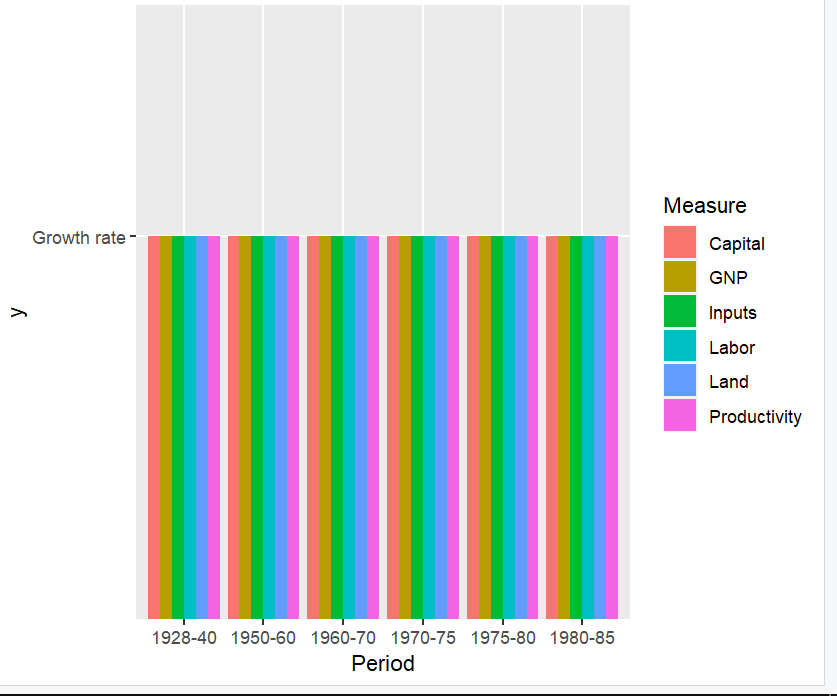
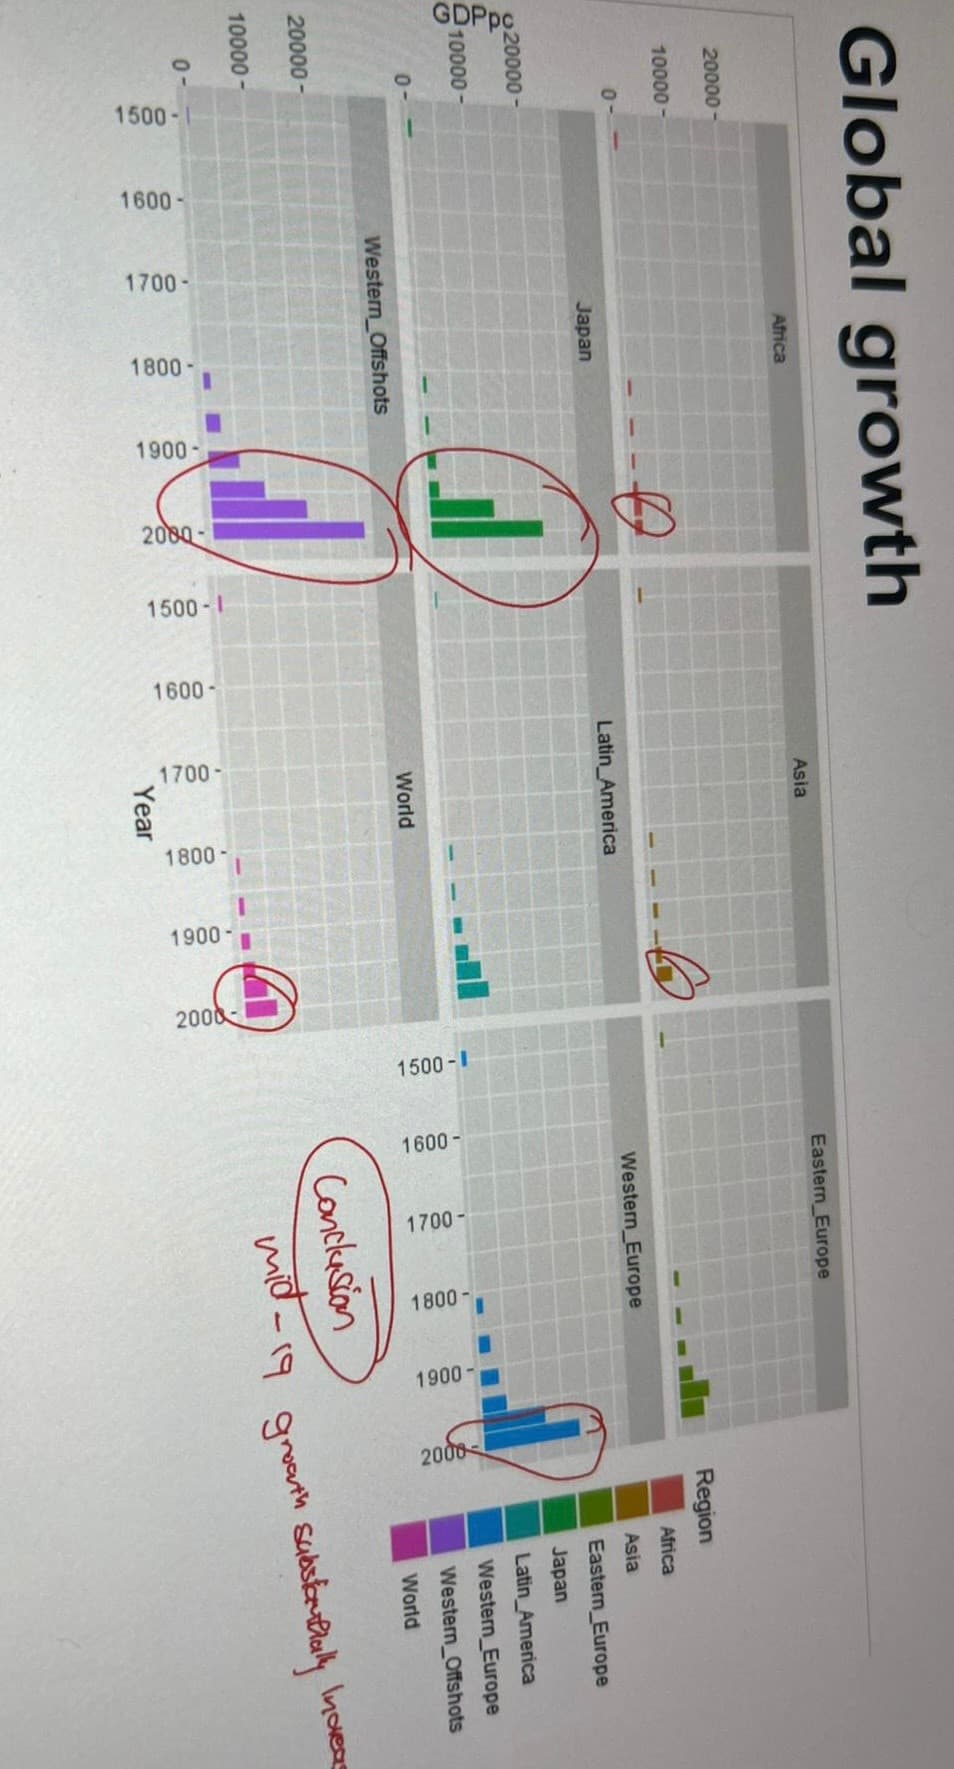
I followed a youtube video so that's why. Now I have deleted the pivoting longer. The graph was generated but it doesn't look as what I wanted. I want it to be categorized in time periods such as in the very first image of this post.
look at your x axis; your x quantity is the text "Time Period", to access a variable in the data.frame passed to ggplot() you normally just write it unqouted (like you did for period, where it has a space you cant do this, so instead you use backticks
x=`Time Period`
this is a repeat of your earlier issue with Growth Rate
Im not sure what your problem is, perhaps you could say more about it.
example
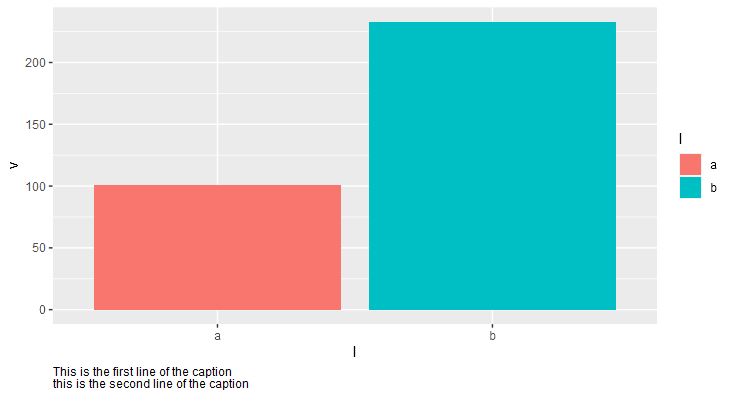
library(tidyverse)

ggplot(data=data.frame(l=letters[1:2],
                       v=c(101,233))) +
  aes(x=l,y=v,fill=l) +
  geom_col() +
  labs(caption="This is the first line of the caption\nthis is the second line of the caption")+theme(
         plot.caption=element_text(hjust = 0)
       )
Here is my code:
barchart<-ggplot()
barchart<-barchart + geom_col(data=slowdown, aes(x=Time Period, y=Growth Rate, fill=Measure), position="dodge")
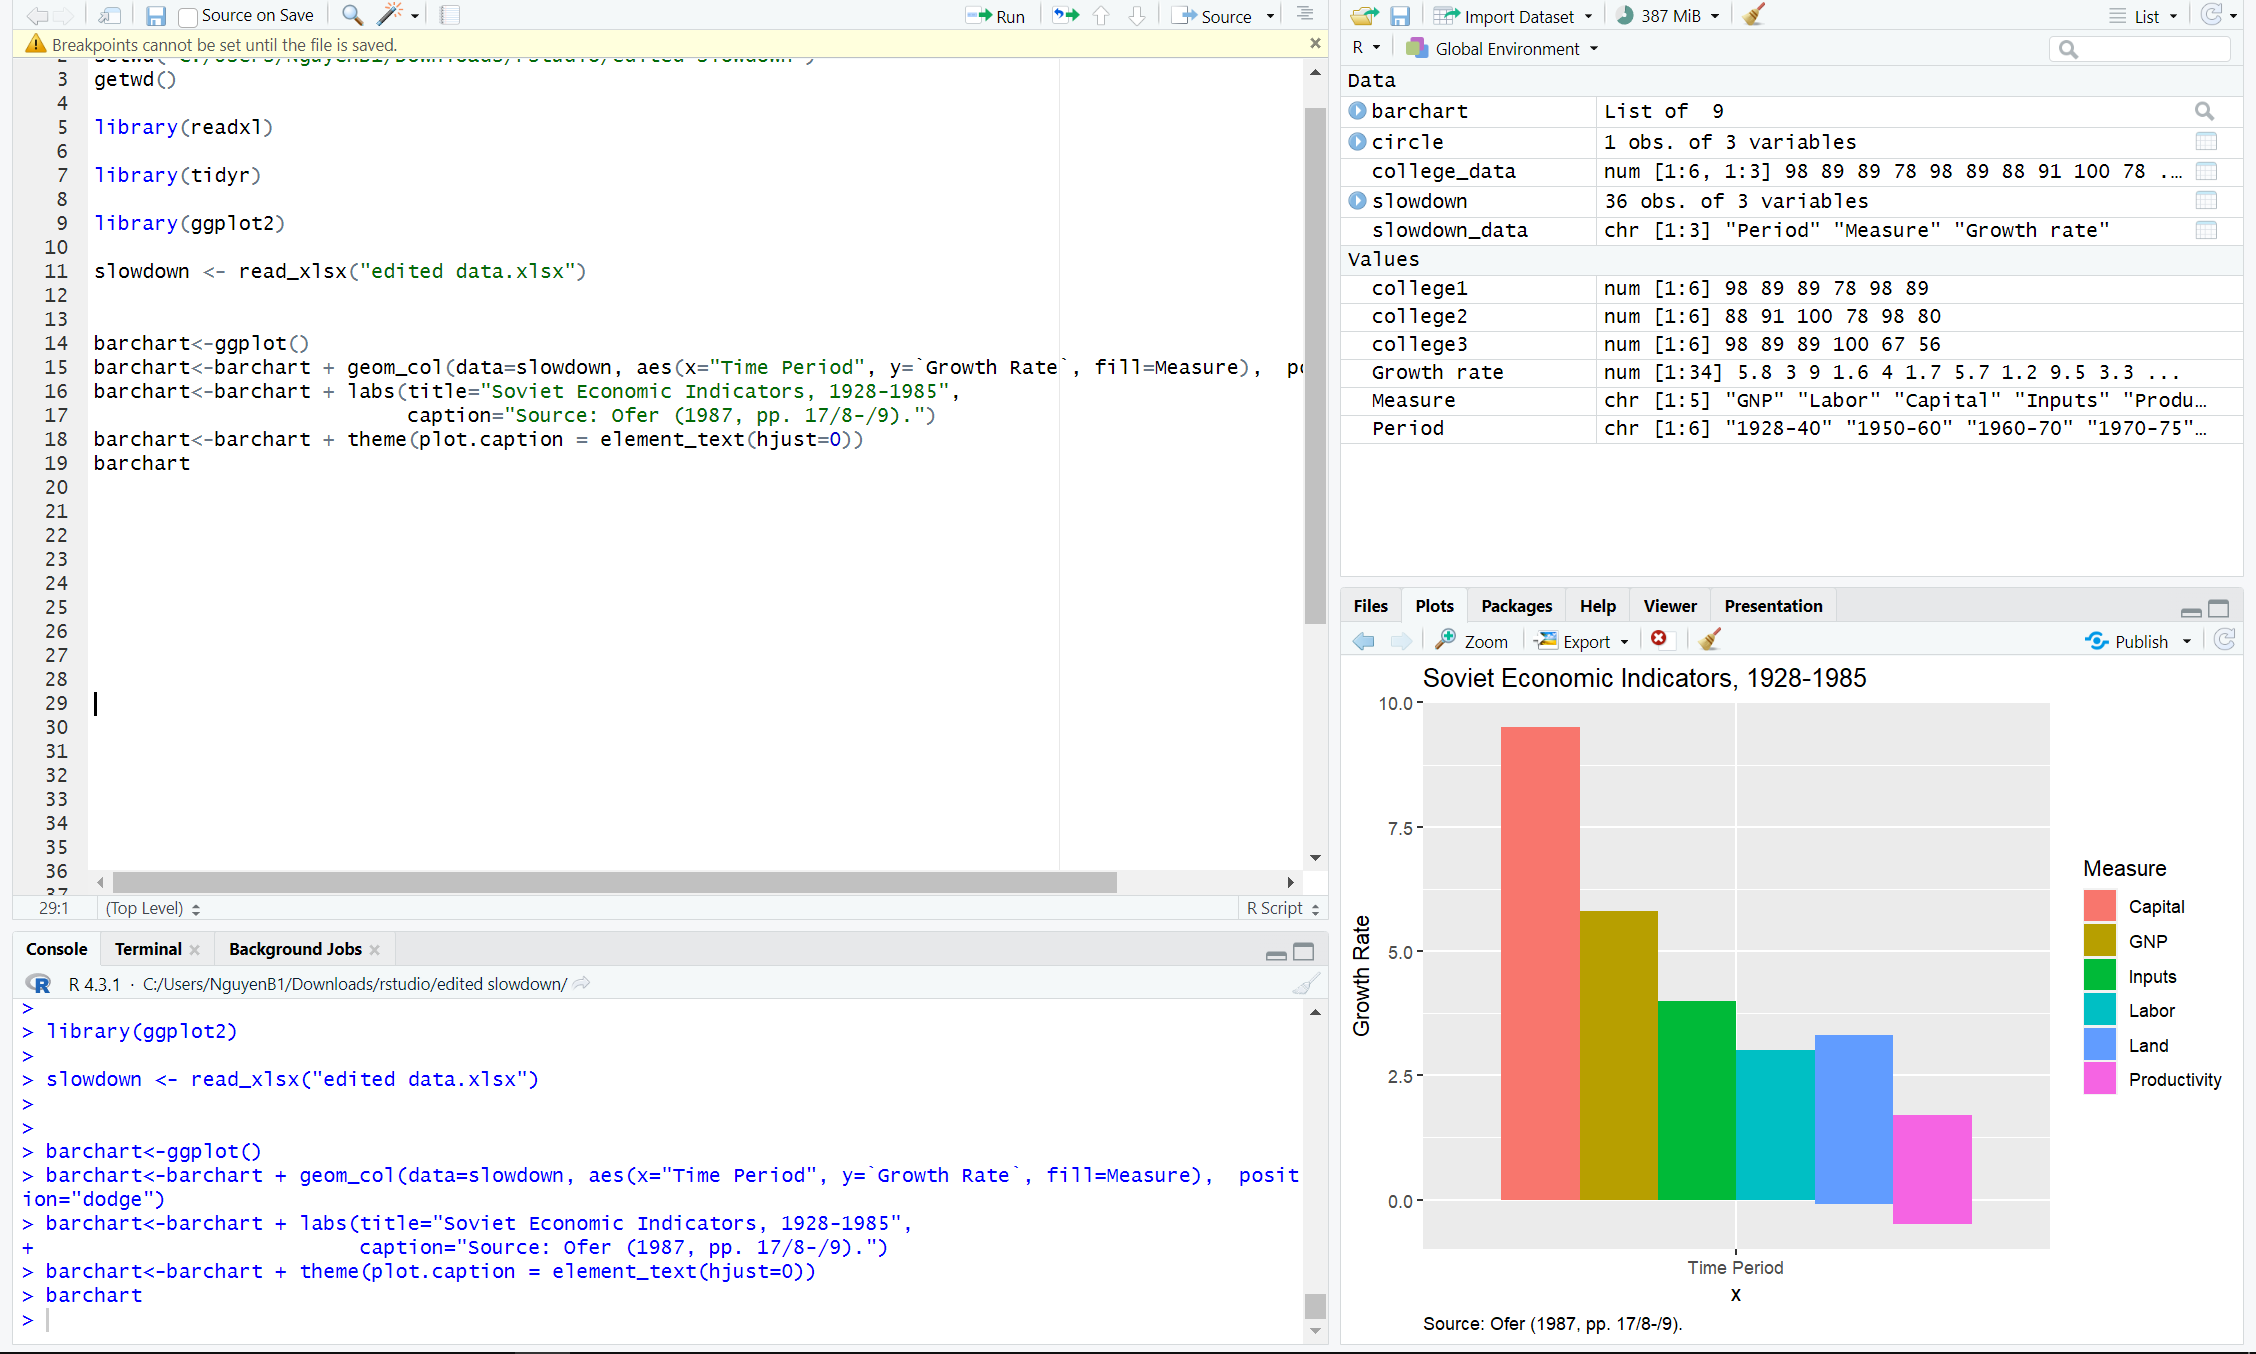
barchart<-barchart + labs(title="Soviet Economic Indicators, 1928-1985",
caption="Source: Ofer (1987, pp. 17/8-/9)\ To emphsize the long-run trends, the figures for the 1940s have been omitted. Growth rates in that decade were very low due to World War II.")+
theme(plot.caption = element_text(hjust=0))
Thanks for your help.
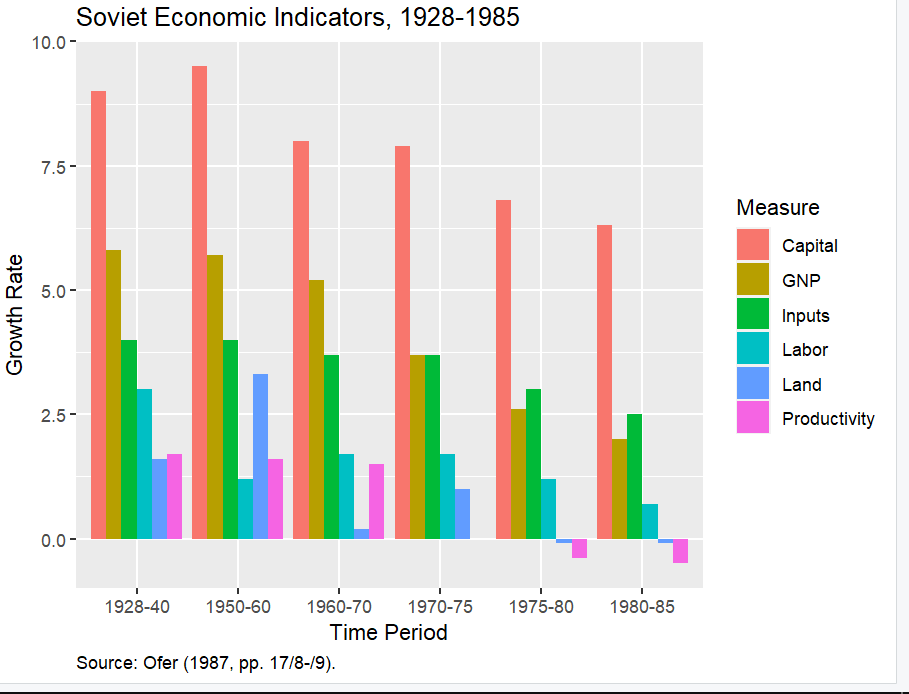
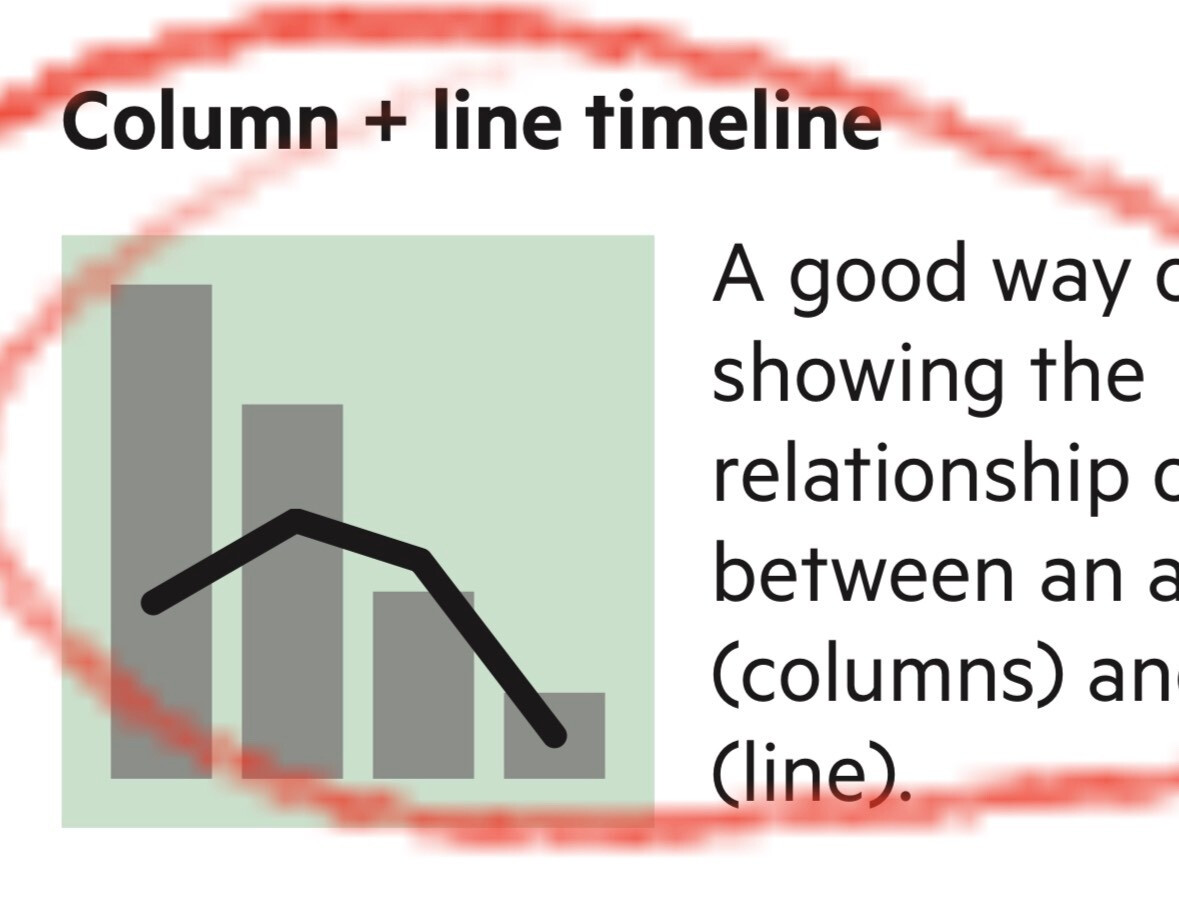
Another question, I now have to generate this type of graph which I have no idea how to. Do you know any resources would help or do you have any guidance?
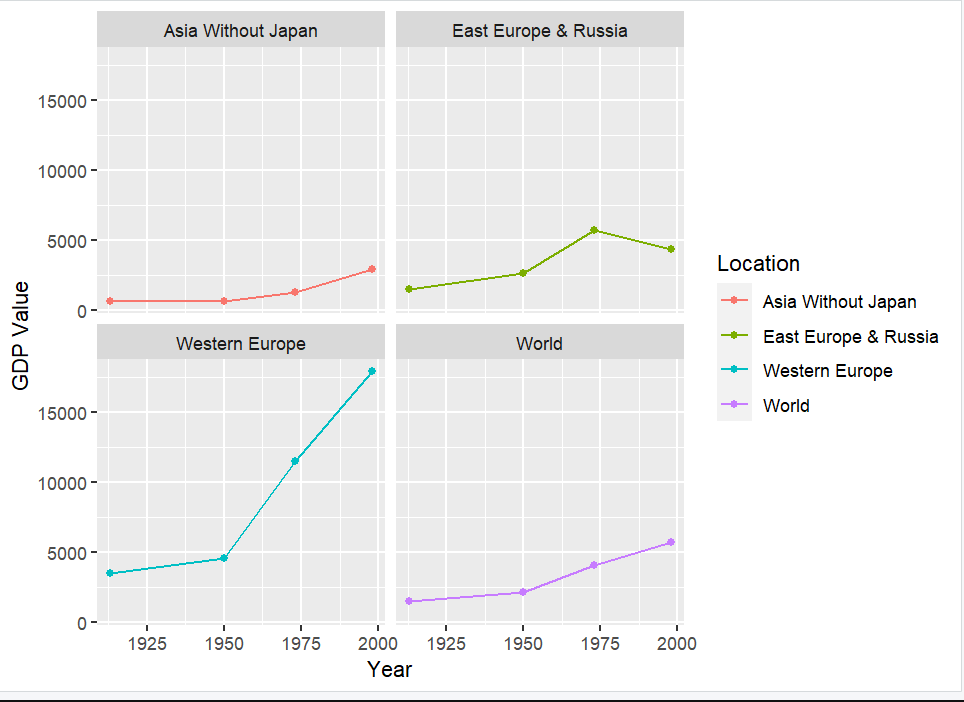
I'm doing the facet_wrap now. I got it to 4 different grids but I want columns instead of lines. Can you show me how to do that? Here's my current graph:
you almost certainly made another chart with geom_line (Linechart) and are confusing that for the chart code that you wrote involving only geom_col and geom_point.
then give either add the facet_wrap code onto the end of it, or give it a name and facet_wrap that name.
Linechart seems irrelevant as your chart code doesnt have an assignment to it .