Hey y'all! Having a bit of a hard time working out this error that keeps on popping up whenever I try and run my function. So, the general purpose of this function is to take the 91 unique dates that I have, find the mean latitude of said dates, and plot the corresponding whale hotspots on a map for each date. The 91 unique dates begin on 2009-08-26 and end on 2018-10-16 with no consistent spacing between dates. The plot.dates() function selects the 14 dates before the unique date and provides a date.range for which the function to select data on.
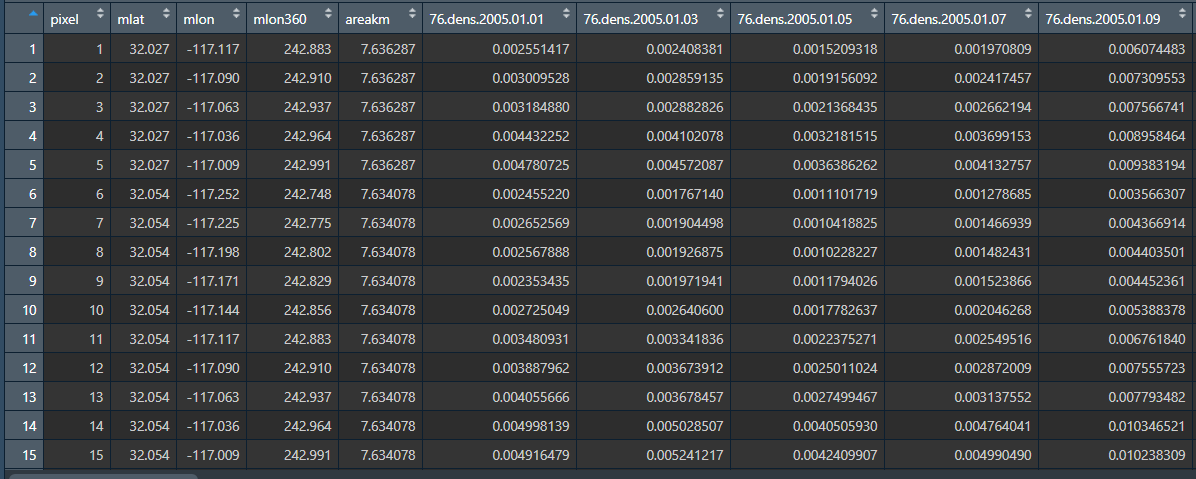
The main problem I am facing is this error message, "Not all column dates fall within an interval defined by range.dates". I believe it has something to do with the class of both dates it is attempting to perform the function with? The plot.dates() class remains in a date format, however, the dates in the x.curr document have prediction data from columns 6 onwards in the form of "76.dens.2005.01.01" where the columns are numeric. Is this what may be causing the problem?
sample.days <- unique(data$Date)
for (i in 1:length(sample.days)) {
mean.lat <- mean(data$Lat[data$Date==sample.days[i]])
plot.ylim <- c((mean.lat-2), (mean.lat+2))
plot.dates <- c(sample.days[i]-13 , sample.days[i])
plot.dates2 <- c(sample.days[i]-6, sample.days[i]+7)
date.type <- "End"
x.14d <- whalepreds_aggregate(
x = x.curr, x.cols = 6:ncol(x.curr), x.col.idx = 9:18,
aggr.level = NULL, range.dates = plot.dates, se.calc = FALSE)
metrics.df.14d <- whalepreds_evaluate(
x = x.14d, y = data,
x.cols = NULL, x.col.idx = 11:20, y.cols = c("Long", "Lat", "Date", "HUWH"),
grid.rad = 0.027/2,
csv.filename = paste0(path.out, plot.name <- paste0(sample.days[i], date.type) ),
plot.path = paste0(path.out),
plot.xlim = c(-126, -117), plot.ylim = plot.ylim,
col.breaks = c(0, 0.01, 0.02, 0.03, 0.05, 0.07, 0.09), col.pal = NULL
)
}
The data that the above function is pulling from is from two files specifically, one defined as x.curr which is the data filled with predictions of densities for a large series of dates from 2005-01-01 to 2019-08-14:. This is the file that has the weird column headers that have columns with a numeric format.
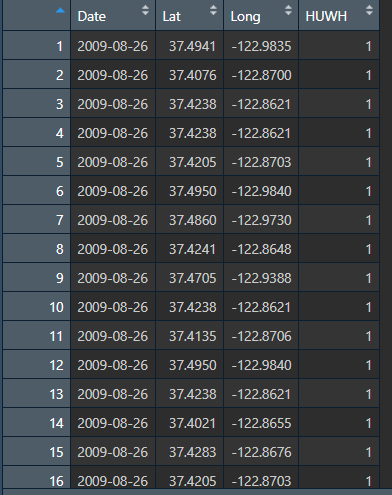
The other file is defined as data and this contains the validation data with a smaller date range from 2009-08-26 to 2018-10-16.