I have combined two columns from an imported set of data into a new table in R. The two columns imported are both numeric. But when I combined them in a table, one of the columns has converted the values to A, B, C etc, and the header is incorrect, and in the other column the values are correct but the header is incorrect.
The first column should say 'height.parents' and the second column should say 'height'.
Any ideas what's happening? I added 'header=TRUE'.
I'm really sorry about that. Here's the code... Note: my code is probably a big mess but I'm very new to R :') and trying to learn....
> setwd("/Users/N/Documents/R")
> cohort <- read.csv("data_2022_nas removed.csv", header=TRUE)
> library(tidyverse)
> library(measurements)
> #this function is the code that transforms inches to cm
> ft_inch <- function(str_ft_inch){
+ elem <- as.integer(unlist(strsplit(str_ft_inch, "'")))
+ inch <- elem[1]*12 + elem[2]
+ return(conv_unit(inch, "inch", "cm"))
+ }
> #now i'm going to transform the inch obs into cm. it worked!
> #thank you to user Flm on RStudio community.
> cohort$height <- sapply(cohort$height, ft_inch) %>%
+ as_tibble() %>%
+ mutate(inc = cohort$height,
+ value = ifelse(!is.na(value), value, inc)) %>%
+ select(value)
> #viewing the result
> View(cohort)
> #now im going to try and convert the other height columns
> cohort$height.dad <- sapply(cohort$height.dad, ft_inch) %>%
+ as_tibble() %>%
+ mutate(inc = cohort$height.dad,
+ value = ifelse(!is.na(value), value, inc)) %>%
+ select(value)
> #and finally to mum
> cohort$height.mum <- sapply(cohort$height.mum, ft_inch) %>%
+ as_tibble() %>%
+ mutate(inc = cohort$height.mum,
+ value = ifelse(!is.na(value), value, inc)) %>%
+ select(value)
> #now converting to numeric
> cohort$height <- as.numeric (unlist(cohort$height))
> cohort$height.dad <- as.numeric (unlist(cohort$height.dad))
> cohort$height.mum <- as.numeric (unlist(cohort$height.mum))
> #creating a new column containing the mean of both parents' heights
> cohort$height.parents=rowMeans(cbind(cohort$height.dad,cohort$height.mum),na.rm=TRUE)
> #creating a new table called heights to tidy up
> heights <- as.table (cohort$height.parents, cohort$height, header=TRUE)
> #now creating a scatter plot
> my.regression <- plot(cohort$height, cohort$height.parents)
> is.numeric(cohort$height.parents)
[1] TRUE
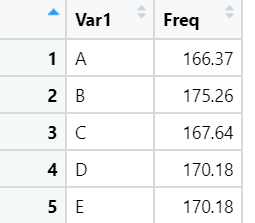
> head(heights)
A B C D E F
166.37 175.26 167.64 170.18 170.18 177.80
Ideas for how you can improve your post to increase your odds of getting help.
Don't include private objects that forum users have no access to. In your case you read in a csv into cohort
It would be wise to omit the reading of the csv and provide a sample of cohort using proven methods (such as dput()
Further, when providing code for consideration; do so from copying out of a script, rather than from out of a console you have run. Otherwise a forum user will have the unpleasant task of removing > from the start of each line and omitting unrunnable output lines such as [1] TRUE (i.e. not code)