I am working with the R programming language.
I made the following map:
library(sf)
library(leaflet)
library(leafgl)
library(colourvalues)
library(leaflet.extras)


nc <- st_read(system.file("gpkg/nc.gpkg", package="sf"), quiet = TRUE) %>%
  st_transform(st_crs(4326)) %>%
  st_cast('POLYGON')

leaflet(data = nc) %>% addPolygons( stroke = FALSE) %>% addTiles(group = "OSM") %>%  addProviderTiles(provider = providers$OpenStreetMap) %>% addPolygons(data = nc, weight=1, popup = ~NAME,
                label = ~NAME, group = "name", col = 'blue') %>%
    addSearchFeatures(targetGroups  = 'name', options = searchFeaturesOptions(zoom=10, openPopup=TRUE))
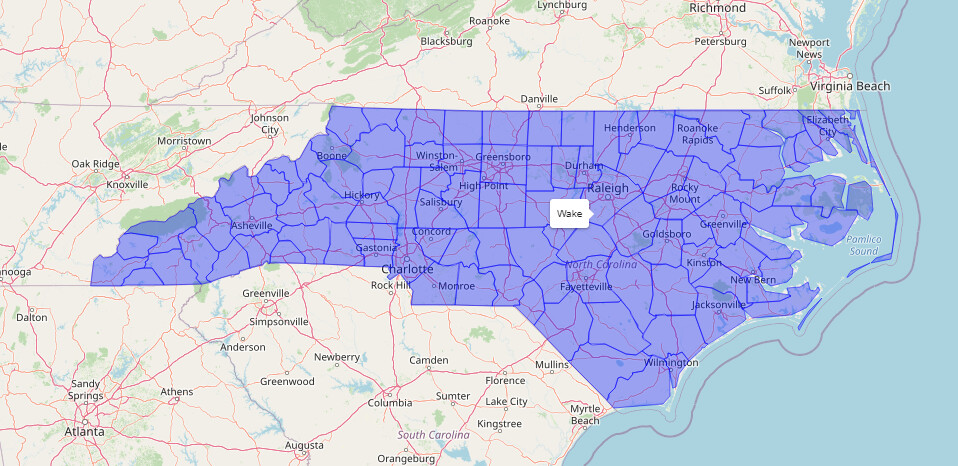
I wanted to color the polygons different colors so that they are a bit easier to see - I did this by randomly assigning colors to the polygons:
nc$color <- sample(c("red", "blue", "green", "yellow", "purple"), nrow(nc), replace = TRUE)

leaflet(data = nc) %>%
    addTiles(group = "OSM") %>%
    addProviderTiles(provider = providers$OpenStreetMap) %>%
    addPolygons(data = nc, weight=1, popup = ~NAME,
                label = ~NAME, group = "name", fillColor = ~color, fillOpacity = 0.5) %>%
    addSearchFeatures(targetGroups  = 'name', options = searchFeaturesOptions(zoom=10, openPopup=TRUE))
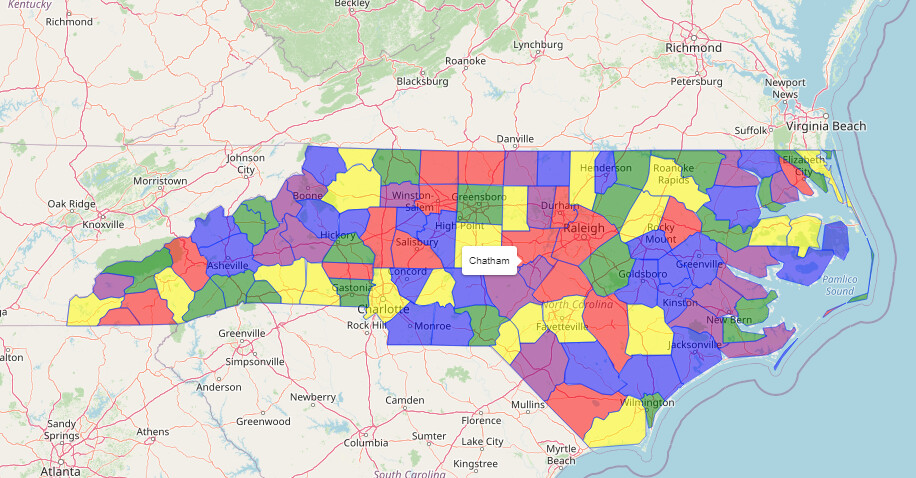
My Question: Taking inspiration from this famous computer science problem Four color theorem - Wikipedia, I would like to randomly color the polygons in such a way that no bordering polygons have the same color.
I think that I first need to convert the shapefile/map into a network graph:
library(igraph)
adj <- st_touches(nc, sparse = TRUE)
g <- graph_from_adjacency_matrix(as.matrix(adj))
plot(g)
I am not sure how to continue this problem - currently, I thought of an indirect method where I simply choose many different random colors to decrease the odds of two polygons having the same color, but I am interested in learning about new and creative ways to solve my original problem.
Can someone please show me how to do this?
Thanks!