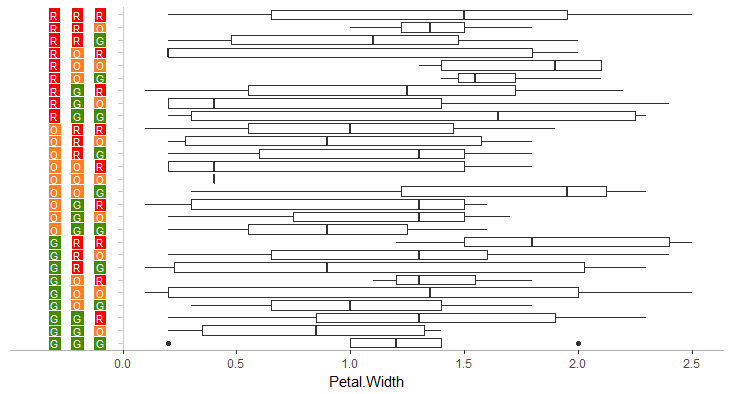
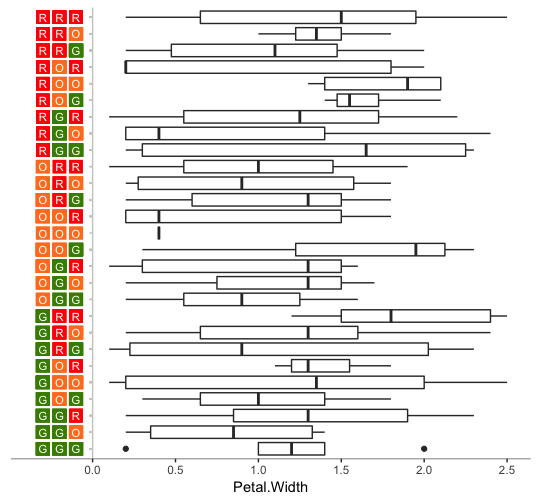
I don't know of a way to use multiple colors within a single axis label. However, you can remove the native ggplot axis and hack your own new axis by plotting lines and symbols in the right places. Below is an example using the built-in iris data frame.
In the code below, we remove the y-axis and replace it with a y-axis at x=0 using geom_vline plus geom_segment for the tick marks. Then we add a call to geom_label to create the colored boxes. In the geom_label call, we do some data transformation to convert the data to long format and generate the x-values for the box locations.
library(tidyverse)
library(ggstance)

# Set up starting data
set.seed(2)
iris$code = replicate(nrow(iris), paste(sample(c("R","O","G"), 3, replace=TRUE), collapse=""))

# Split code column into three columns, one for each letter value
iris = cbind(iris, str_split_fixed(iris$code, "", 3))

ggplot(iris, aes(Petal.Width, code)) +
  geom_boxploth() +
  geom_vline(xintercept=0, colour="grey80") +
  geom_segment(aes(x=-0.02, xend=0, yend=code), colour="grey80") +
  geom_label(data=iris %>% gather(key, value, `1`:`3`) %>%
               mutate(key = -0.1 * (4 - as.numeric(key))),
             aes(x=key, fill=value, label=value), color="white", size=3,
             label.size=0, label.padding=unit(2,"pt"), label.r=unit(0,"pt")) +
  coord_cartesian(xlim=c(-0.35, max(iris$Petal.Width))) +
  scale_fill_manual(values=c("R"="red","O"="chocolate1", "G"="chartreuse4")) +
  theme_classic() +
  theme(axis.text.y=element_blank(),
        axis.ticks.y=element_blank(),
        axis.line.y=element_blank(),
        axis.title.y=element_blank(),
        axis.line.x=element_line(colour="grey70")) +
  guides(fill=FALSE)
If you prefer unlabeled boxes, replace the geom_label code with the following and change to guides(colour=FALSE):
geom_point(data=iris %>% gather(key, value, `1`:`3`) %>%
             mutate(key = -0.1 * (4 - as.numeric(key))),
           aes(x=key, colour=value), shape=15, size=4)