Hersh
June 29, 2022, 5:48pm
1
Hi,
This firts code work well
eco <- as.character(Env$Clust

fviz_pca_biplot(res.pca, repel = TRUE,
                col.var = "cos2",
                gradient.cols = c("#00AFBB", "#E7B800", "#FC4E07")
                )
This one work well also and with this one I have my ind colored but I don't have my colored var with cos2
fviz_pca_biplot(res.pca, label="var", habillage=iris$Species,
               addEllipses=TRUE, ellipse.level=0.95)
How can I merge these two code ?
fviz_pca_biplot(res.pca, repel = TRUE,
                col.var = "cos2",
                gradient.cols = c("#00AFBB", "#E7B800", "#FC4E07"),
                habillage = eco
                )
Hi @Hersh , remember put a reporducible example of data for better help you, like this dput() or reprex
Here's a discussion on setting up data for a reprex
make it run - include the minimal code required to reproduce your error on the data provi…
Check this documentation for know more about PCA
A practical guide to Principal Component Analysis (PCA) in R with FactoMineR and factoextra: compute PCA with PCA(), read the eigenvalues and scree plot, draw the variable correlation circle, rank variable contributions and cos2, plot the...
Hersh
June 30, 2022, 7:01pm
3
Hello
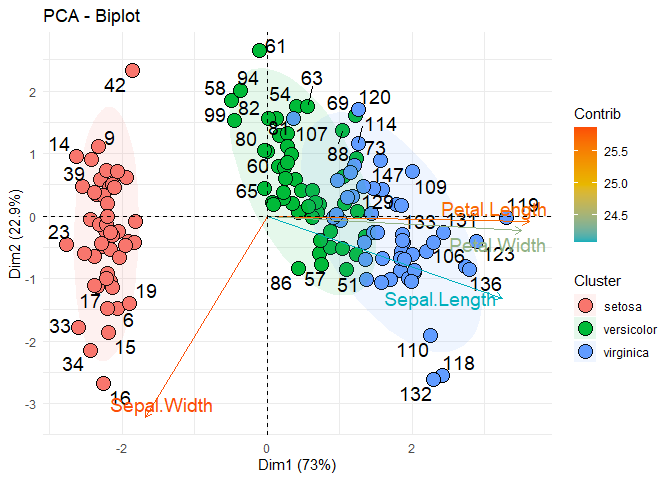
So here a example :
library(factoextra)
library(ggplot2)
data <- iris
habillage <- as.character(data$Species)
res.pca <- prcomp(data[,1:4],  scale = TRUE)

fviz_pca_biplot (res.pca,
                 # Individuals
                 geom.ind = c("point","text"),
                 fill.ind = habillage,
                 pointshape = 21, pointsize=5,
                 palette = "set2",labelsize = 5,
                 addEllipses=TRUE, ellipse.level=0.90, mean.point =FALSE, label="all",
                 repel = TRUE,
                 #variables
                 col.var="contrib",gradient.cols = c("#00AFBB", "#E7B800", "#FC4E07")) +
  labs(fill = "Cluster", color = "Contrib", alpha = "contrib") +
  theme_minimal()
#> Warning: ggrepel: 106 unlabeled data points (too many overlaps). Consider
#> increasing max.overlaps
I succeed to have both my Cluster color and "contrib" color but I just want to modify the Cluster color
I tried many way but also the same problem about "discrete value supplied to continus scale" and so one...
Hersh
June 30, 2022, 7:22pm
4
Ok, so apparently it was as simple as doing this :
palette = c("green","blue","red")
I'm not used to R being simple from time to time!